Generic selectors
Exact matches only
Search in title
Search in content
Post Type Selectors

Popular stocks

Crypto

CFD

Currencies

Support

Gold

AUD/USD – Technical Analysis – 4h

November 13, 2025 13:03

Quick Summary

The chart for AUD/USD displays a strong bullish trend, characterized by recent momentum and breakout patterns.

Signs of increasing volume and MACD support the current trend, suggesting further upside potential.

This analysis focuses on key levels and potential strategies for trading the pair.

Candlestick Analysis

The chart shows a recent bullish trend with higher highs and higher lows.

A notable candlestick pattern observed is a series of bullish candlesticks around November 11th, indicating momentum in favor of the bulls.

There was a breakout past the previous resistance level near 0.6520, suggesting potential for continued upside movement.

MACD Analysis

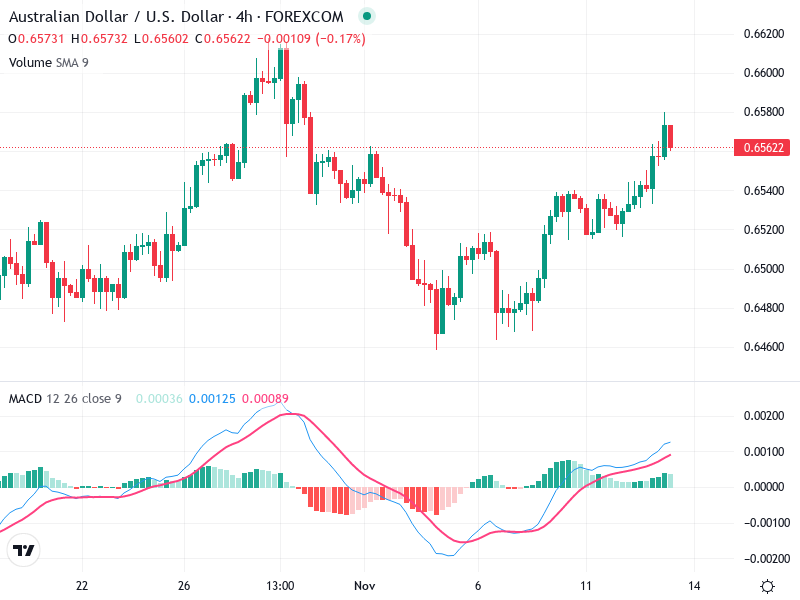
The MACD line is above the Signal line, indicating a bullish crossover, which suggests ongoing positive momentum.

The MACD histogram is positive and increasing, reflecting strengthening momentum in the current uptrend.

No significant divergences are noted between the MACD and price action, aligning the indicator with the upward trend.

Volume Analysis

Recent candlesticks are supported by increasing volume, confirming the strength of the breakout.

There are noticeable spikes in volume corresponding with the upward price movement, possibly indicating institutional buying or strong interest at these levels.

Volume analysis plays a crucial role in confirming trends and identifying potential reversals.

Support & Resistance

Key support levels can be identified around 0.6500, which was a previous resistance and may now serve as a support in case of a pullback.

Resistance is seen near recent highs around 0.6600, a crucial level to watch for potential breakout.

Monitoring support and resistance areas can provide insights into potential breakout or reversal scenarios.

Actionable Insights

Consider buying on pullbacks to the support level around 0.6500, with confirmation of support holding.

Look for a test of the resistance around 0.6600. A break above this could signal further upside.

Monitor for signs of reversal or weakening momentum, such as a bearish crossover in MACD or a decrease in volume.

The AI Technical Analysis Center is an informational tool only and does not constitute investment or trading advice.
This site is registered on wpml.org as a development site. Switch to a production site key to remove this banner.