Generic selectors
Exact matches only
Search in title
Search in content
Post Type Selectors

Popular stocks

Crypto

CFD

Currencies

Support

Gold

AUD/USD – Technical Analysis – 4h

August 29, 2025 07:06

Quick Summary

The chart illustrates a shift from a bearish to a bullish trend, characterized by higher highs and higher lows. Significant candlestick patterns suggest a continuation of the uptrend. The price is currently testing critical resistance levels.

Candlestick Analysis

There are bullish engulfing patterns visible in the recovery phase, particularly around the reversal from the lower levels near 0.6400, indicating strong buying pressure that reversed a downtrend.

The current candlestick pattern shows a potential continuation of the uptrend, as the price is pushing against previous highs.

The chart indicates a recovery from a bearish to a bullish trend, marked by higher highs and higher lows.

MACD Analysis

The MACD line is above the Signal line, indicating a bullish crossover that suggests positive momentum.

The histogram shows expanding positive bars, which reflect increasing bullish momentum.

There are no noticeable divergences between the MACD and price action, which supports the current upward trend.

Volume Analysis

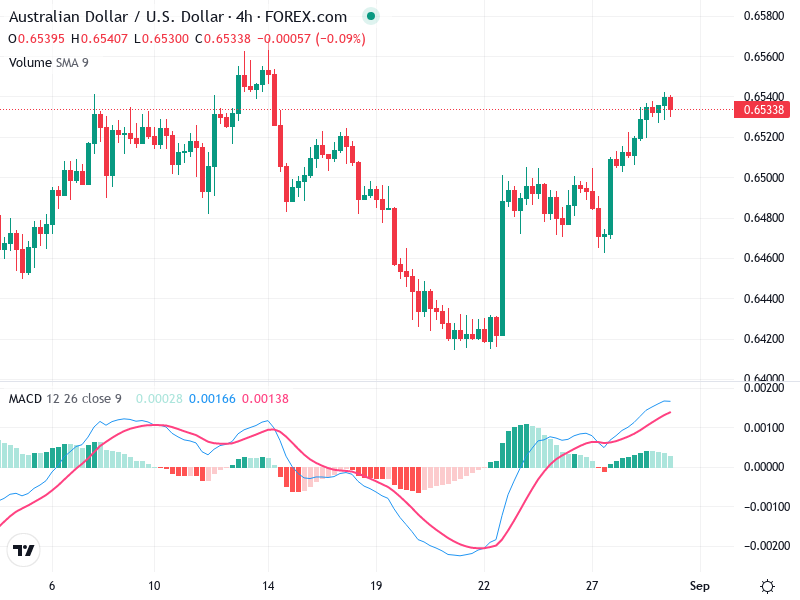
There is a noticeable increase in volume during the recent price rally, which indicates strong buyer interest. However, the volume is slightly declining as it approaches the resistance level, which may suggest caution.

The increase in volume supports the bullish price movement, but watch for a potential decrease in momentum if the volume does not increase further on a breakout attempt.

Volume will be a key factor in confirming sustained momentum in either direction.

Support & Resistance

Around 0.6540, a key level the price is currently testing.

Near 0.6400, which acted as a significant support during the recent downturn and subsequent recovery.

Monitor the resistance level closely for signs of a breakout or reversal.

Actionable Insights

Consider buying if the price breaks and closes above the 0.6540 resistance with increased volume for confirmation.

Look for short opportunities if the price fails to break the resistance and shows signs of reversal, such as a bearish candlestick pattern.

If already in a position, holding may be advised until clear indications for a breakout or reversal are observed.

The AI Technical Analysis Center is an informational tool only and does not constitute investment or trading advice.
This site is registered on wpml.org as a development site. Switch to a production site key to remove this banner.