Generic selectors
Exact matches only
Search in title
Search in content
Post Type Selectors

Popular stocks

Crypto

CFD

Currencies

Support

Gold

AUD/USD – Technical Analysis – 4h

November 25, 2025 13:03

Quick Summary

The AUD/USD 4-hour chart is currently in a consolidation phase.

The asset shows a transition from bearish to sideways movement.

Traders should look for key breakouts or breakdowns.

Candlestick Analysis

The chart shows a recent bearish to sideways transition. Initially, there was a downtrend that stabilized near the current price levels.

There are no strong candlestick reversal patterns evident, such as bullish engulfing or hammer, indicating indecision at current levels.

Immediate support appears around the 0.6440 level. Resistance is around 0.6480 - 0.6500. A break above or below these zones could signal future price direction.

MACD Analysis

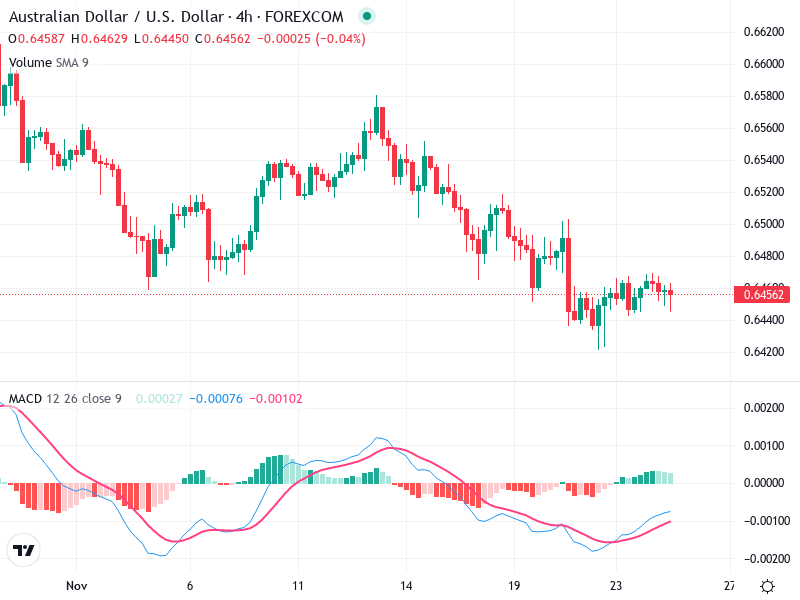
The MACD line is slightly below the Signal line, indicating a weak bearish sentiment, but the lines are converging.

The histogram shows decreasing bearish momentum as it moves toward the zero line, suggesting potential stabilization or reversal.

There aren't clear divergences with the price, but the decreasing negative momentum could indicate waning selling pressure.

Volume Analysis

Volume appears relatively stable with no significant spikes, indicating a lack of strong buying or selling conviction.

The stable volume corroborates the sideways price movement, pointing to market indecision.

No unusual volume spikes are visible, suggesting minimal institutional activity in the recent period.

Support & Resistance

Strong support is noted around 0.6440, which has held up during recent tests.

Immediate resistance is around 0.6480 - 0.6500, marking a key barrier for bulls to overcome.

Breaks of these levels could signify new momentum and potential trend shifts.

Actionable Insights

Consider buying on a breakout above 0.6500 with confirmed volume and MACD bullish crossover.

Consider selling if there is a breakdown below 0.6440 supported by increasing volume.

Holding may be prudent until clearer signals emerge due to current sideways movement.

The AI Technical Analysis Center is an informational tool only and does not constitute investment or trading advice.
This site is registered on wpml.org as a development site. Switch to a production site key to remove this banner.