Generic selectors
Exact matches only
Search in title
Search in content
Post Type Selectors

Popular stocks

Crypto

CFD

Currencies

Support

Gold

AUD/USD – Technical Analysis – 4h

November 27, 2025 13:02

Quick Summary

The Asset chart reveals a significant shift in momentum. Initially, a downtrend is observed, followed by a recovery trend with higher highs. Pay attention to the resistance and support levels, which could indicate future movements.

Candlestick Analysis

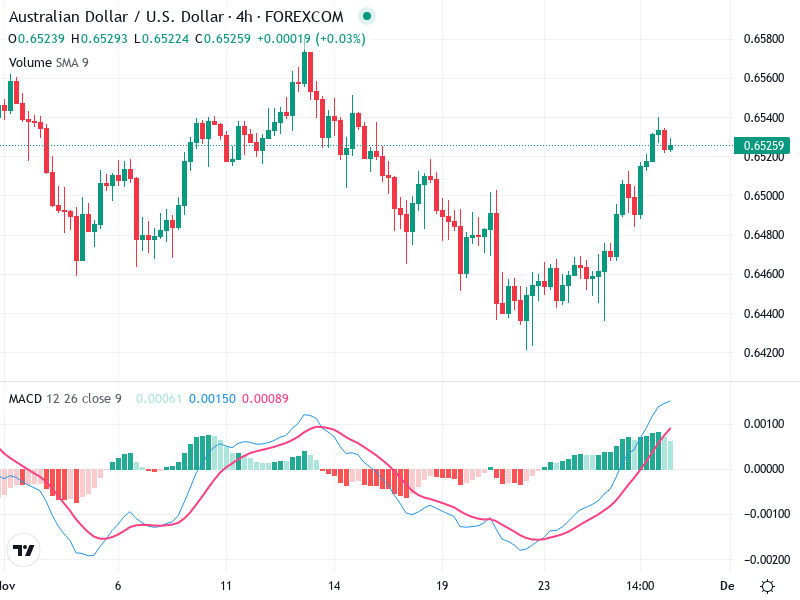
A potential bullish engulfing pattern emerges mid-chart, hinting at a reversal to an uptrend.

Recent candlesticks with small bodies suggest market indecision at current levels.

The chart shows an initial downtrend followed by a recovery with higher highs and lows.

MACD Analysis

A bullish crossover between MACD and Signal line indicates upward momentum.

The MACD histogram shows increasing positive bars, signaling strengthening bullish momentum.

No divergences between MACD and price action support the current trend.

Volume Analysis

Volume remains stable, with no significant spikes during recent price movements.

The lack of volume surge in the upward move suggests caution.

Volume does not indicate strong institutional buying or selling pressure.

Support & Resistance

Resistance around 0.6540 and support near 0.6440 are key levels to watch.

Break above 0.6540 with volume can confirm a bullish trend continuation.

A fall below 0.6440 may signal a bearish reversal.

Actionable Insights

Consider buying on a convincing break above 0.6540 with increased volume.

If resistance holds and bearish patterns emerge, consider selling or holding positions.

Look for confirmation signals such as sustained volume increases or bullish MACD crossovers.

The AI Technical Analysis Center is an informational tool only and does not constitute investment or trading advice.
This site is registered on wpml.org as a development site. Switch to a production site key to remove this banner.