Generic selectors
Exact matches only
Search in title
Search in content
Post Type Selectors

Popular stocks

Crypto

CFD

Currencies

Support

Gold

AUD/USD – Technical Analysis – 4h

December 8, 2025 13:02

Quick Summary

The chart for is exhibiting interesting movements, characterized by recent trends and patterns. Analysts are closely observing key levels as they assess the potential for upcoming shifts in momentum.

This analysis delves into various technical indicators to provide insights into potential future price directions for .

Candlestick Analysis

The chart shows a clear bullish trend with higher highs and higher lows since mid-November.

Recent candlesticks exhibit small bodies with longer upper wicks, suggesting potential buying pressure waning or resistance near the current level.

The area around 0.6650 may serve as a resistance level, with previous momentum trying to break through this point.

MACD Analysis

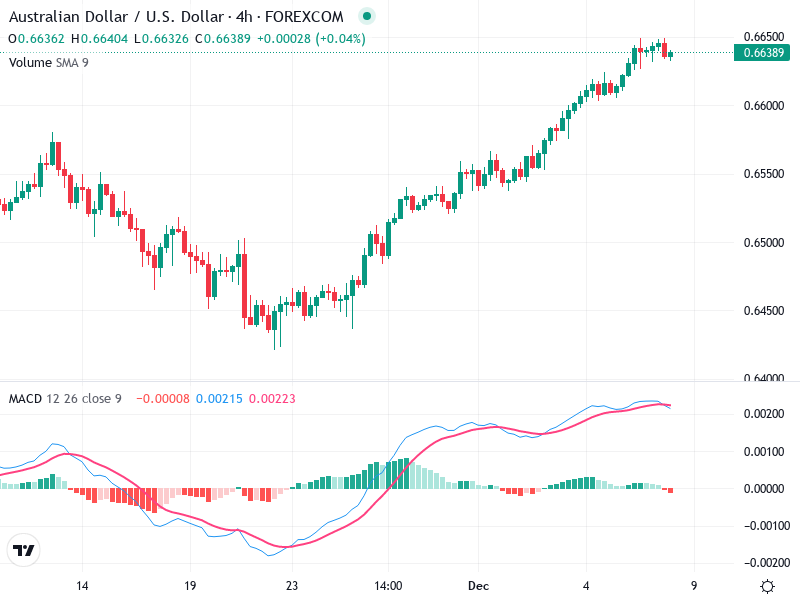
The MACD line is above the Signal line, indicating bullish momentum. However, they appear to be converging, which could signal a potential bearish crossover.

The histogram bars are decreasing, suggesting weakening momentum.

There is no significant divergence between the MACD and the price, but watch for any changes as the MACD approaches the Signal line.

Volume Analysis

Generally steady volume accompanies the uptrend.

Current price movements are not strongly supported by concurrent volume increases, indicating potential caution.

No significant volume spikes suggestive of institutional activity are evident.

Support & Resistance

Support is around 0.6550 based on previous consolidation and pullback levels.

Resistance is currently at 0.6650, which is being tested multiple times, indicating it's a strong resistance area.

Monitoring these levels is crucial for determining potential breakout or reversal scenarios.

Actionable Insights

Consider buying if the price decisively breaks and closes above 0.6650 with increased volume, indicating resistance is overcome.

If a clear bearish crossover occurs in the MACD, watch for retracement toward the support at 0.6550 for potential sell opportunities.

If the market continues sideways near resistance and MACD shows little momentum, holding off on entering may be prudent.

The AI Technical Analysis Center is an informational tool only and does not constitute investment or trading advice.
This site is registered on wpml.org as a development site. Switch to a production site key to remove this banner.