Generic selectors
Exact matches only
Search in title
Search in content
Post Type Selectors

Popular stocks

Crypto

CFD

Currencies

Support

Gold

AUD/USD – Technical Analysis – 4h

December 23, 2025 13:02

Quick Summary

The 4-hour chart of AUD/USD shows a reversal from a previous downtrend to a bullish trend. The asset has broken above key resistance levels, indicating potential for continued upward movement.

Current technical indicators, including MACD and volume, support a bullish outlook.

Candlestick Analysis

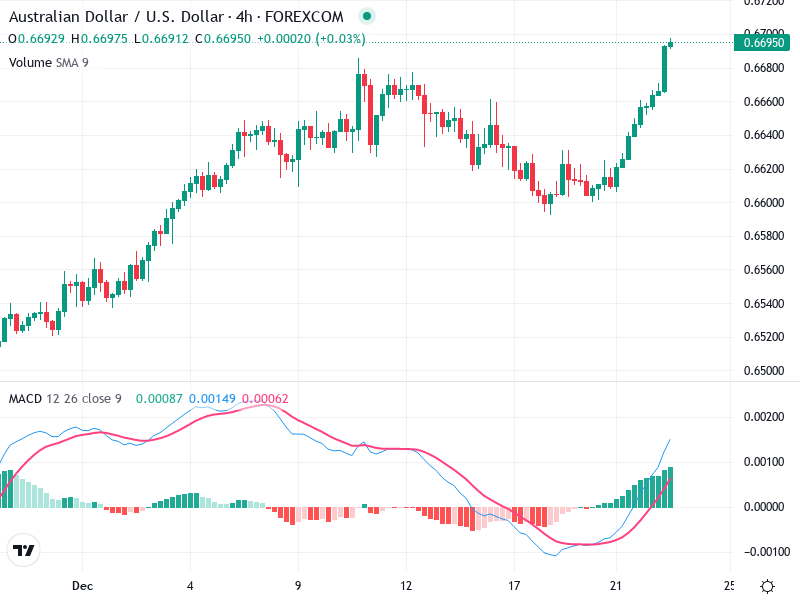
Recently, there is a strong bullish candlestick pattern indicating upward momentum. The previous downtrend seems to have reversed with this move.

The chart shows a recent bullish trend. Prior to this, the AUD/USD experienced a corrective phase, evident in the sideways-to-downward movement.

The price has broken out above key resistance near 0.6660, suggesting a potential continuation of the uptrend.

MACD Analysis

The MACD line is above the Signal line, with a bullish crossover having occurred recently. This indicates upward momentum.

The histogram bars are increasing, supporting the bullish momentum and suggesting strengthening momentum.

Currently, there is no visible divergence between MACD and price action, affirming the current trend's validity.

Volume Analysis

There is a noticeable increase in volume accompanying the recent price rise, confirming the bullish move.

The rising volume supports the price increase, reducing the likelihood of a false breakout.

The volume spike suggests potential institutional interest or significant buying activity driving the uptrend.

Support & Resistance

The next resistance level is around 0.6700.

The previous resistance at 0.6660 now acts as support.

These levels are crucial for monitoring potential pullbacks or continuation patterns.

Actionable Insights

Consider initiating a long position on pullbacks to the new support at 0.6660, watching for continued volume support.

If a bearish reversal pattern forms near the resistance at 0.6700 with declining volume.

If already holding long positions, consider trailing stops to protect gains as the price approaches resistance.

The AI Technical Analysis Center is an informational tool only and does not constitute investment or trading advice.
This site is registered on wpml.org as a development site. Switch to a production site key to remove this banner.