January 9, 2026 13:04
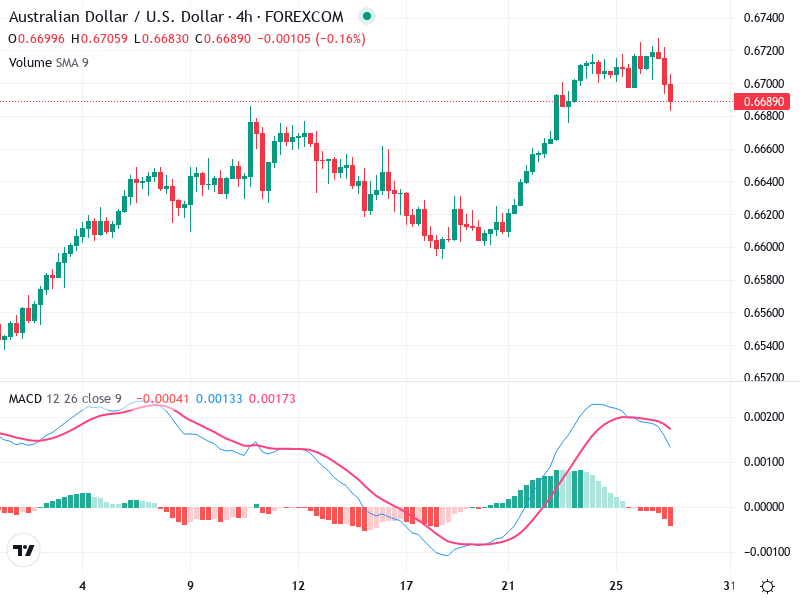
The AUD/USD chart shows a series of bullish candlesticks leading up to a recent peak. A bearish candlestick follows, indicating a potential reversal or pullback. The 0.6700-0.6720 area is a critical resistance level, while support is seen around 0.6660. Traders should watch for signals near these levels.
Currently, the trend is bullish in the medium term with indications of a short-term pullback. Monitoring external factors, such as global economic conditions, is also important.
The chart depicts a series of bullish candlesticks leading up to the recent peak.
A bearish candlestick indicates potential reversal or pullback, which traders should be wary of.
The breakout above 0.6700 was significant but now faces resistance, causing a pullback.
The MACD line is crossing below the Signal line, suggesting a bearish crossover and potential downturn.
The MACD histogram is transitioning from positive to negative, indicating a loss of bullish momentum.
There are no clear divergences between the MACD and price action at this moment.
There was an increase in volume during the recent price rise, followed by a decrease during the pullback.
The rising volume in the uptrend supports the bullish move.
Meanwhile, the decline in volume during the pullback could suggest it is temporary.
Key support is around 0.6660, where previous consolidation occurred.
Key resistance lies in the 0.6700-0.6720 area, a significant level after the breakout.
Monitoring these levels is crucial for traders for potential entry or exit points.
Consider watching for price action signals near the support level around 0.6660 for potential buys.
If the price fails to hold the support, it could be a short opportunity.
If in position, monitor the 0.6660 support for signs of reversal or breakdown.