Generic selectors
Exact matches only
Search in title
Search in content
Post Type Selectors

Popular stocks

Crypto

CFD

Currencies

Support

Gold

AUD/USD – Technical Analysis – 4h

December 31, 2025 13:02

Quick Summary

The AUD/USD 4H chart reveals notable patterns offering insights into potential price movements. The asset displays both bullish tendencies and consolidation phases, reflecting mixed trading sentiments. Key support and resistance levels also offer strategic entry and exit points for traders.

Candlestick Analysis

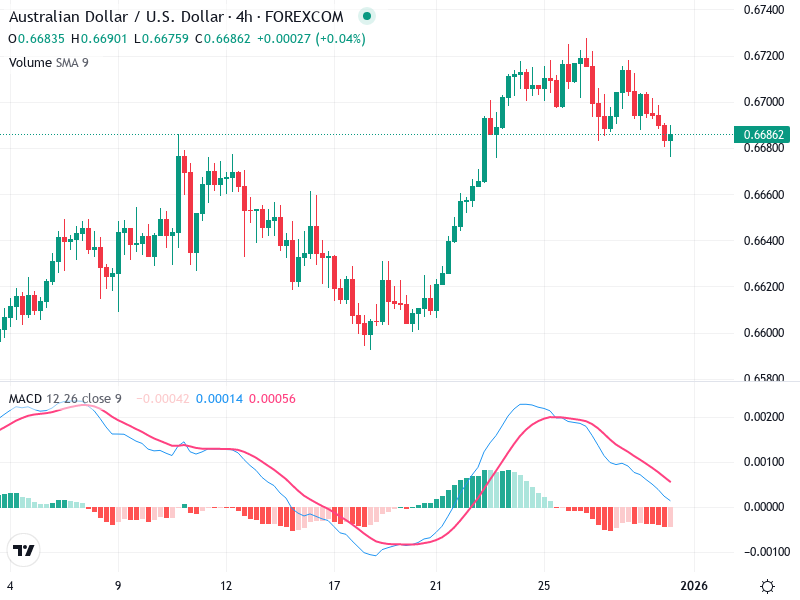
A bullish engulfing pattern appears around the chart's midpoint, indicating a potential reversal from the prior downtrend.

Smaller-bodied candles with longer wicks observed recently suggest market indecision or consolidation.

The overall trend is bullish due to a steep upward movement, but recent sideways movement signals potential consolidation or minor pullback.

MACD Analysis

The MACD line is positioned below the Signal line, indicating a recent bearish crossover.

The histogram is negative and expanding, which suggests increasing bearish momentum.

No significant divergences between the MACD and price action are visible at this time.

Volume Analysis

Trading volume appears consistent without significant spikes, indicating that recent moves are not strongly supported by volume changes.

The lack of a notable increase in volume during recent upward price movements may suggest less conviction behind the bullish push.

The trading volume does not indicate strong support for recent price movements.

Support & Resistance

Resistance is found near 0.6710, a level where price has faced multiple rejections.

Support appears around 0.6650, where price previously rebounded, indicating buyer interest.

Key support and resistance levels provide strategic entry or exit points for trades.

Actionable Insights

Buying is suggested if price remains above the 0.6650 support and MACD shows signs of bullish momentum.

Consider selling if price decisively breaks below the 0.6650 support with increased volume.

If indecision candles continue to appear, waiting for a decisive breakout is advisable.

The AI Technical Analysis Center is an informational tool only and does not constitute investment or trading advice.
This site is registered on wpml.org as a development site. Switch to a production site key to remove this banner.