Generic selectors
Exact matches only
Search in title
Search in content
Post Type Selectors

Popular stocks

Crypto

CFD

Currencies

Support

Gold

AUD/USD – Technical Analysis – 4h

January 1, 2026 13:02

Quick Summary

The AUD/USD 4-hour chart shows a recent trend that has experienced a pullback.

This pullback follows a period of higher highs and higher lows indicating an overall bullish movement. The asset is currently consolidating around key levels.

Candlestick Analysis

The chart exhibits a recent bullish trend that has transitioned into a pullback.

No prominent candlestick reversal patterns are evident, but recent bearish candles indicate a pullback from the highs around the 0.67200 level.

The overall trend prior to this was bullish with higher highs and higher lows.

MACD Analysis

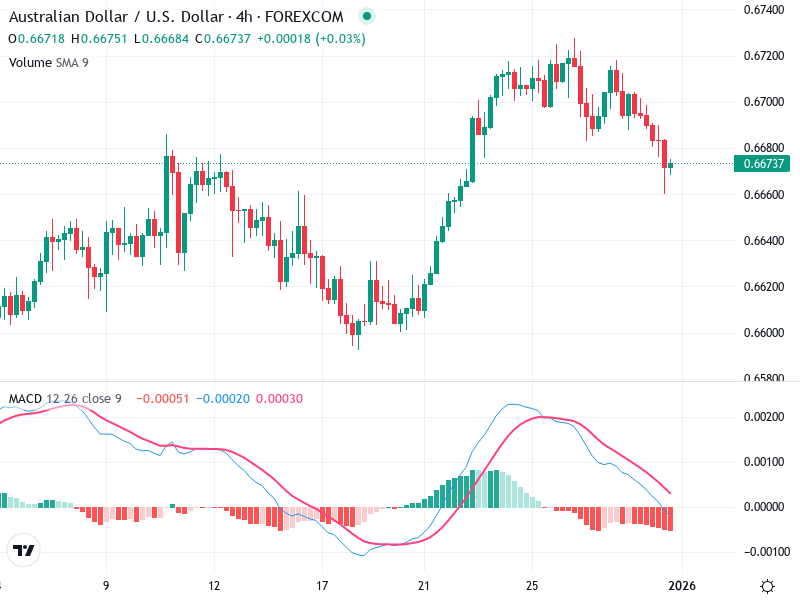
There is a bearish crossover with the MACD line crossing below the Signal line, suggesting potential further downside momentum.

The MACD histogram is negative and increasing in size, which supports bearish momentum and the recent price pullback.

No clear divergence between the MACD and price action is evident at this point.

Volume Analysis

Volume appears to be generally stable, with no unusually significant spikes or troughs.

The volume does not currently contradict the pullback, as it has not shown any unusual increase to suggest a strong opposing sentiment.

No visible spikes in volume that indicate significant institutional buying or selling.

Support & Resistance

Key support level is around 0.66600, which coincides with previous lows.

Resistance is noted near 0.67200, which aligns with recent highs before the current pullback.

These levels are crucial for detecting potential reversals or further movements. A close below support may signal further downside.

Actionable Insights

Monitor for bearish confirmation below 0.66600. A sustained move below this could signal a stronger downward trend.

Look for bullish signals around the support level at 0.66600 for potential rebound plays.

Watch for a potential test of the recent support zone. Confirmation of a rebound or further breakdown is crucial.

The AI Technical Analysis Center is an informational tool only and does not constitute investment or trading advice.
This site is registered on wpml.org as a development site. Switch to a production site key to remove this banner.