December 2, 2025 08:04
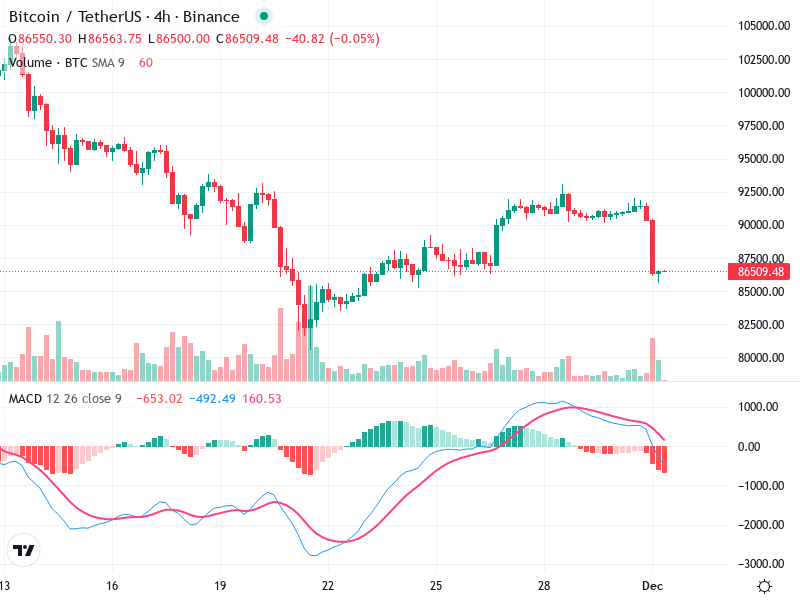
The Bitcoin /TetherUS chart reveals a recent bullish crossover indicated by the MACD, suggesting potential upward momentum.
However, the presence of significant resistance levels may impact further price movement.
Volume confirmation remains crucial for determining the sustainability of this trend.
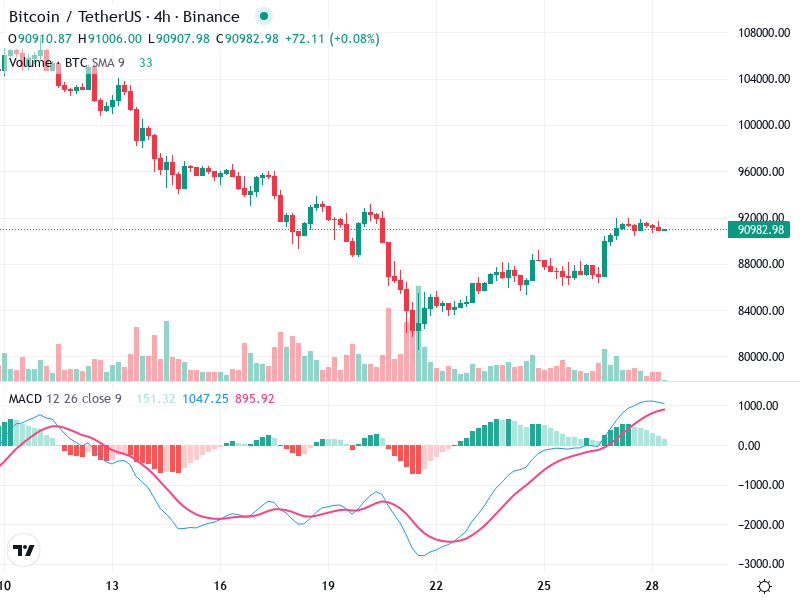
The chart shows an overall bearish trend, with a recent consolidation in price suggesting a potential reversal or continuation pattern.
There is a bullish engulfing pattern visible before the recent rise indicating increased buying pressure at lower levels.
Price appears to be consolidating after a minor upward movement, which could represent a pullback if prices break above the recent high of around 88,000.
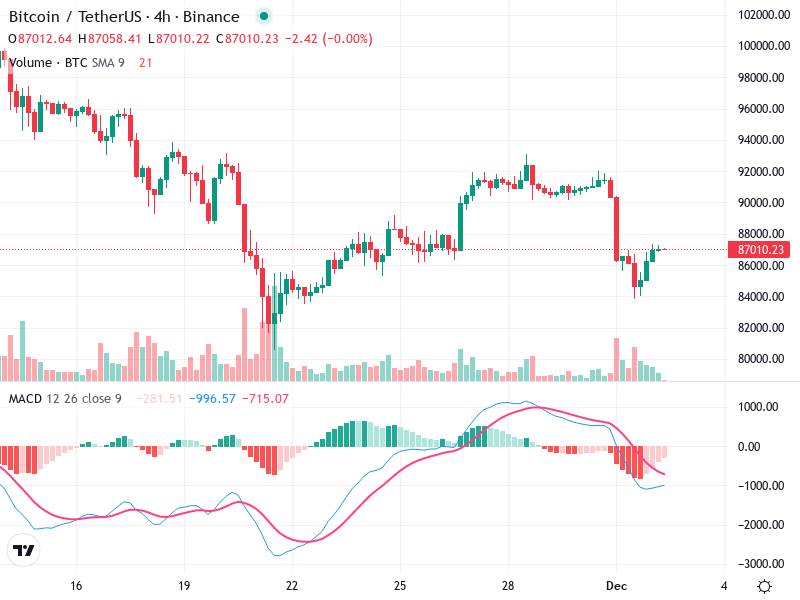
The MACD line is above the Signal line, indicating a recent bullish crossover, suggesting a shift in momentum towards the upside.
The histogram is positive and increasing, further supporting the bullish sentiment, although slight flattening near the end suggests waning momentum.
No significant divergence is currently observed between MACD and price movements.
There was an increase in volume during the recent upward price movement, supporting the buying interest.
The recent decline in volume during the price consolidation phase suggests a lack of strong selling pressure.
No extraordinary spikes indicating excessive buying or selling pressure from institutions.
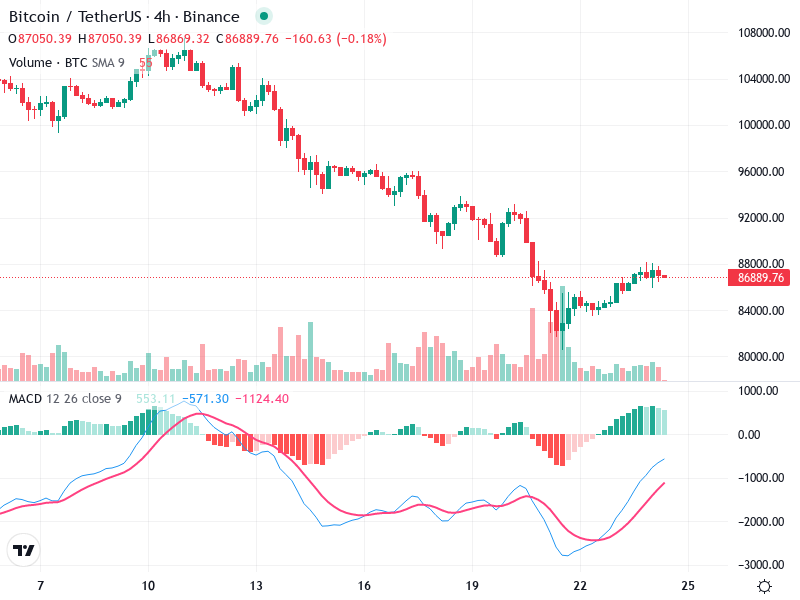
Near-term support is around the 84,000 level, where previous buying activity was observed.
Significant resistance is seen around the 88,000 to 90,000 range, which price needs to break to continue its upward trajectory.
A buy strategy could be considered if price breaks and sustains above the 88,000 resistance with increased volume for confirmation.
Be cautious of a potential trend reversal if the price fails to break above current resistance and falls below the 84,000 support level.
Confirmation of momentum from the MACD and any increase in volume during breakout attempts.