Generic selectors
Exact matches only
Search in title
Search in content
Post Type Selectors

Popular stocks

Crypto

CFD

Currencies

Support

Gold

EUR/USD – Technical Analysis – 1D

August 21, 2025 07:02

Quick Summary

The EUR/USD daily chart exhibits a congested trading range, indicating consolidation between key levels. Recent price action suggests potential for a substantial move once a breakout occurs. Technical indicators provide insights into momentum and support/resistance zones.

Candlestick Analysis

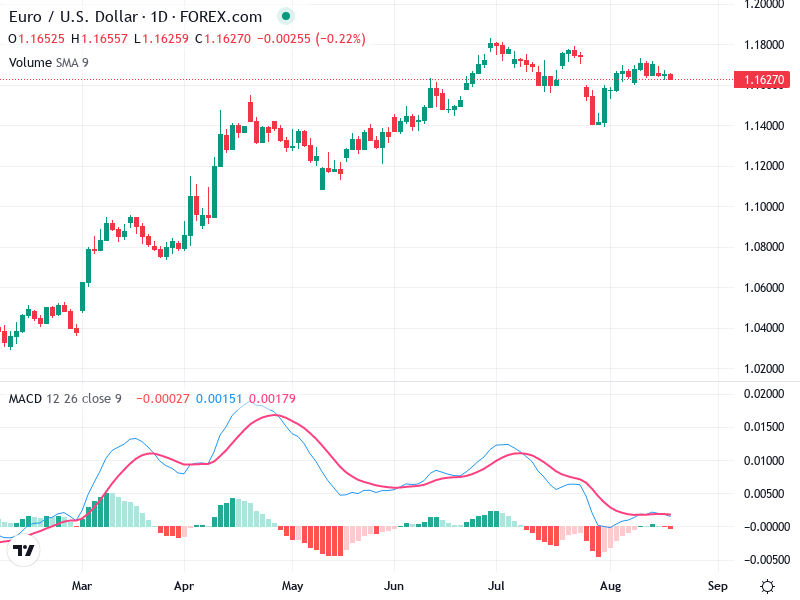
Recently, small-bodied candles have appeared, signifying indecision or a slowdown in momentum, typically observed during consolidation phases.

Bearish candles preceded the current range, suggesting a pullback from highs, yet longer wicks on some candles indicate buying pressure at lower levels.

The overall trend is bullish with higher highs and higher lows observed from March through June, although currently moving sideways within a range of 1.16 to 1.18.

MACD Analysis

The MACD line recently crossed below the signal line, indicating a potential bearish signal.

Both lines are near zero, suggesting a lack of strong momentum or a consolidation phase.

The histogram is slightly negative, showing bearish momentum but has started flattening and moving towards zero, suggesting decreasing bearish pressure.

Volume Analysis

Volume has been average with no notable spikes, aligning with the current consolidation phase.

The lack of significant volume spikes suggests subdued institutional activity, indicating that consolidation might persist until volume confirms a breakout.

Overall, volume analysis supports the ongoing neutral phase, awaiting key price level breaches for confirmation.

Support & Resistance

Resistance is observed at 1.18, with multiple touches highlighting its importance.

Support is around 1.15, a zone that previously acted as a reversal point.

A breakout above 1.18 with high volume could suggest continued bullish momentum, while a break below 1.15 may signal a deeper pullback.

Actionable Insights

Traders may consider buying on a confirmed breakout above 1.18, ideally with increased volume as a strength confirmation.

Consider selling or shorting if the price breaks below the 1.15 support level paired with a bearish MACD signal.

Watch for a breakout from the current consolidation range and monitor the MACD for potential crossovers alongside volume analysis for move confirmations.

The AI Technical Analysis Center is an informational tool only and does not constitute investment or trading advice.
This site is registered on wpml.org as a development site. Switch to a production site key to remove this banner.