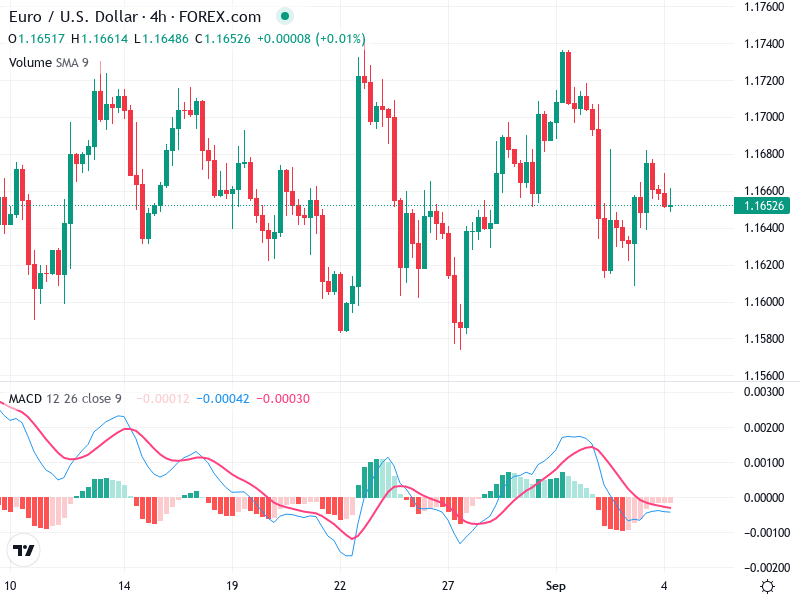
The chart indicates a lack of significant trends, with sideways movement prevalent. Monitoring key levels could offer trading insights. A breakout above resistance may suggest bullish potential, while a move below support could indicate bearish tendencies.
Candlestick Analysis
The chart shows several candlestick patterns, including a potential bullish engulfing pattern near August 20.
Overall, the pattern appears mixed with no consistent long-term trend.
Resistance is around 1.1720, and support is around 1.1580.
MACD Analysis
The MACD line is slightly below the Signal line, indicating bearish sentiment.
The close proximity suggests weak momentum.
No significant divergences between MACD and price action are visible, aligning with the sideways trend.
Volume Analysis
The volume spikes on August 22 and 26 indicate potential institutional activity.
Overall volume trends are relatively stable.
The volume supports the range-bound price action, with no significant divergence.
Support & Resistance
Resistance is approximately 1.1720.
Support is approximately 1.1580.
Breaking above resistance could signal entry for bullish trades, while falling below support may indicate bearish opportunities.
Actionable Insights
Consider buying if the price breaks above resistance with strong volume.
Consider selling if the price drops below support, accompanied by increased volume.
Current conditions favor a hold strategy due to the lack of decisive movement.
The AI Technical Analysis Center is an informational tool only and does not constitute investment or trading advice.