Generic selectors
Exact matches only
Search in title
Search in content
Post Type Selectors

Popular stocks

Crypto

CFD

Currencies

Support

Gold

EUR/USD – Technical Analysis – 4h

January 21, 2026 08:02

Quick Summary

The Asset chart reveals signs of a bullish reversal after an extended downtrend. Key indicators such as candlestick patterns and MACD line positioning support this shift in momentum. A noticeable increase in volume further strengthens this analysis.

Candlestick Analysis

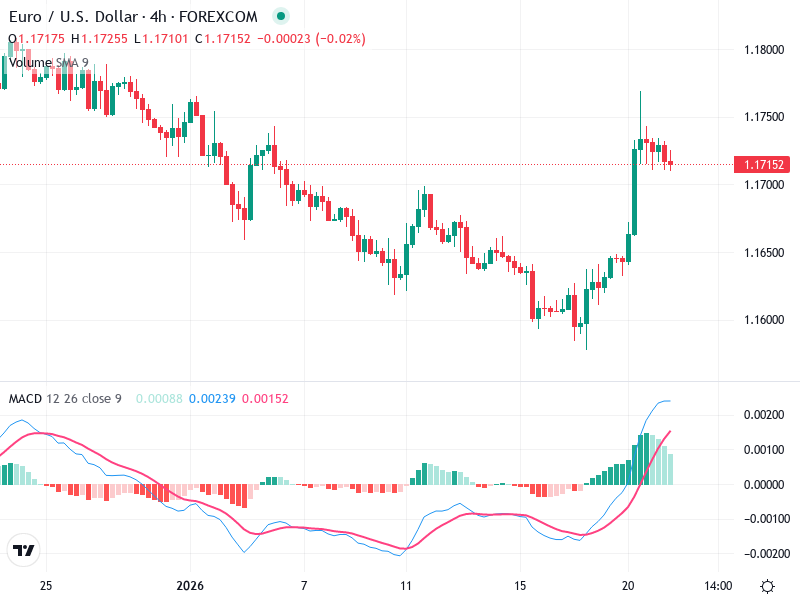
The chart shows a recent bullish reversal after a prolonged downtrend, indicated by a series of higher green candlesticks.

There's a notable bullish engulfing pattern near the reversal point, signaling potential upward momentum.

The price moved significantly higher around the 1.1650 level, breaking previous resistance zones, indicating a potential shift in sentiment.

MACD Analysis

The MACD line is currently above the Signal line, indicating bullish momentum.

Positive values in the MACD histogram suggest increasing bullish momentum. However, the histogram shows a slight decrease, which might indicate a potential slowing down of upward momentum.

No significant divergences observed, suggesting price action and MACD are aligned.

Volume Analysis

There is a noticeable increase in volume corresponding with the recent price surge, supporting the bullish breakout and indicating strong buying interest.

The volume supports the upward movement, reinforcing the credibility of the bullish reversal.

The recent volatility suggests active market sentiment, which requires monitoring for sudden shifts.

Support & Resistance

A key support level appears around the 1.1650 area, previously a resistance now turned support.

Resistance can be noted near the 1.1750 level, where the price recently faced selling pressure.

Continuation of volume trends will be crucial for sustaining any bullish movements.

Actionable Insights

Consider entering a long position if the current uptrend sustains above the 1.1650 support with increasing volume. Confirmation through a continued bullish MACD is ideal.

Signs of weakening momentum, such as a bearish crossover in MACD or a fall below the 1.1650 support, could suggest caution or potential exit points.

A pullback to the support level could occur; maintaining a stop loss just below this level would manage risks.

The AI Technical Analysis Center is an informational tool only and does not constitute investment or trading advice.
This site is registered on wpml.org as a development site. Switch to a production site key to remove this banner.