Generic selectors
Exact matches only
Search in title
Search in content
Post Type Selectors

Popular stocks

Crypto

CFD

Currencies

Support

Gold

EUR/USD – Technical Analysis – 4h

January 28, 2026 08:03

Quick Summary

The chart presents a strong bullish trend characterized by recent upward momentum. has shown resilience at key support levels, which might play a pivotal role in future price movements. Investors should closely watch emerging patterns for actionable trading opportunities.

Candlestick Analysis

The chart indicates a strong bullish trend over recent periods with a parabolic rise in price.

The most recent candles suggest some selling pressure, hinting at resistance around the 1.2050 level, evident from the longer upper wicks.

There was a breakout above 1.1900, making it a potential pullback support zone.

MACD Analysis

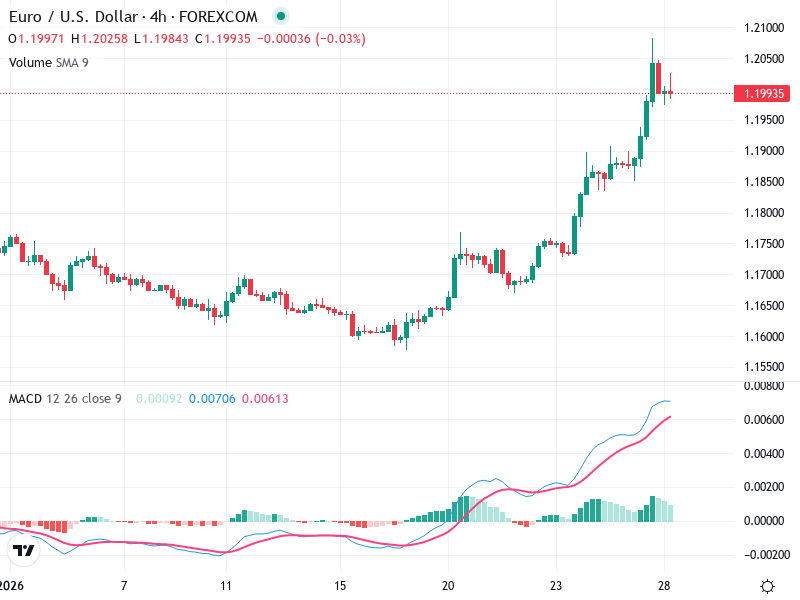
The MACD line is above the signal line, indicating bullish momentum, although the lines are showing signs of convergence.

The MACD histogram shows decreasing bullish momentum, suggesting an emerging potential for a trend reversal or consolidation.

There's no clear divergence, but watch for weakening momentum against rising prices.

Volume Analysis

Volume appears relatively stable with no significant spikes during the latest price action, which may indicate the current trend lacks strong buying support.

The absence of significant volume on recent peaks could suggest a weaker upward drive and potential retracement risk.

No major spikes indicating institutional activity.

Support & Resistance

1.1900 acts as a strong support level after the breakout.

1.2050 is notable resistance where recent price action has stalled.

Watching these levels is crucial for anticipating potential reversals or confirming trends.

Actionable Insights

Consider buying on a pullback near the 1.1900 support if there's a bullish reversal pattern and volume confirmation.

Selling, or taking profit, could be considered if the price fails to break above 1.2050 and there's a bearish pattern formation.

Holding might be suitable with a close eye on sustaining above 1.1900.

The AI Technical Analysis Center is an informational tool only and does not constitute investment or trading advice.
This site is registered on wpml.org as a development site. Switch to a production site key to remove this banner.