Generic selectors
Exact matches only
Search in title
Search in content
Post Type Selectors

Popular stocks

Crypto

CFD

Currencies

Support

Gold

EUR/USD – Technical Analysis – 4h

January 30, 2026 08:02

Quick Summary

The 4-hour chart for EUR/USD indicates a recent bullish trend reaching a peak before undergoing a correction.

Currently, the pair is experiencing a pullback phase, with indications of potential trend reversals.

Candlestick Analysis

Recent candlestick patterns suggest a strong bullish trend that peaked, followed by a potential bearish engulfing pattern indicating a reversal.

The overall trend remains bullish, but recent consolidation could change this outlook.

The price reached a high near 1.2100 and is now pulling back, stabilizing around 1.1940.

MACD Analysis

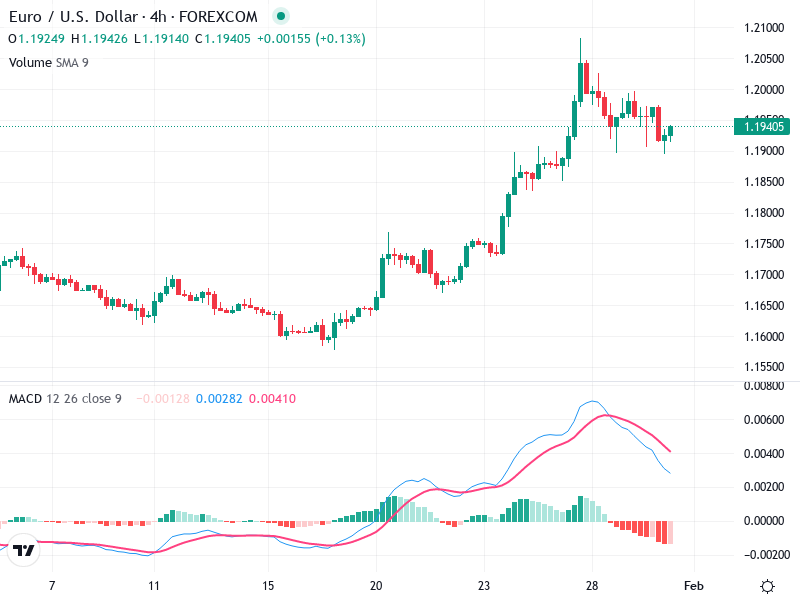
The MACD line has crossed below the Signal line, indicating a bearish crossover and potential downward momentum.

The histogram is negative, supporting the pullback notion with decreasing bullish momentum.

There might be a bearish divergence with the price making higher highs and the MACD not following, indicating weakening momentum.

Volume Analysis

High volume during the bullish move towards the peak was followed by reduced volume during the pullback.

The volume on the ascent supports the upward move, while decreased volume on the pullback suggests weak selling pressure.

Current trading activity implies a pause in strong buying interest, with traders waiting for further confirmation.

Support & Resistance

Key support is around 1.1900, which is the current price consolidation region.

Immediate resistance is near the recent high of 1.2100.

A break above resistance with significant volume might indicate a continuation of the bullish trend.

Actionable Insights

Traders might consider holding or a cautious buy if support at current levels stabilizes.

Conservative traders may wait for a breakout above 1.2100 before entering long positions.

It is crucial to watch for confirmation of support at 1.1900 and potential bullish signals like a MACD crossover or bullish candlestick patterns.

The AI Technical Analysis Center is an informational tool only and does not constitute investment or trading advice.
This site is registered on wpml.org as a development site. Switch to a production site key to remove this banner.