Generic selectors
Exact matches only
Search in title
Search in content
Post Type Selectors

Popular stocks

Crypto

CFD

Currencies

Support

Gold

EUR/USD – Technical Analysis – 4h

February 2, 2026 08:02

Quick Summary

The EUR/USD 4-hour chart provides insights into the recent price movements and potential future trends. The asset has shown significant activity around key support and resistance levels.

This analysis will cover candlestick patterns, MACD momentum, and volume changes to give a holistic view of the market conditions.

Candlestick Analysis

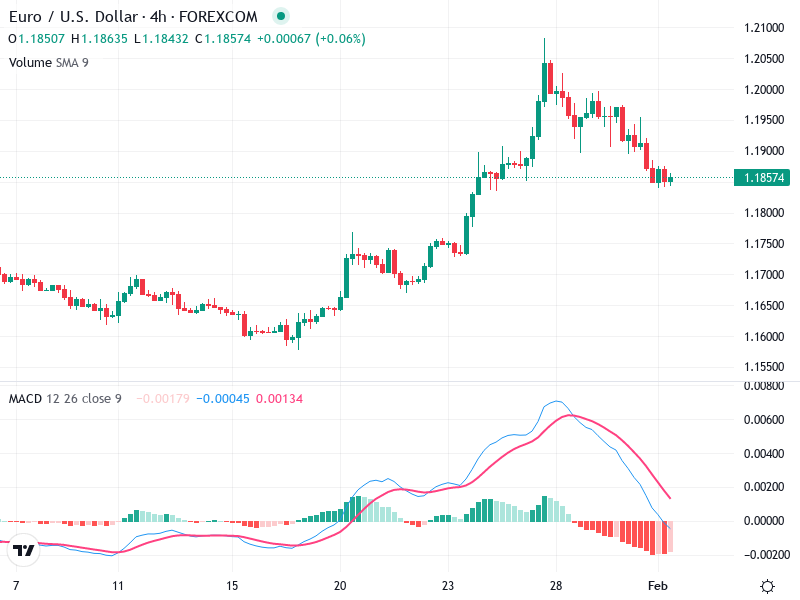
The recent bullish trend peaked near the 1.2100 level and has since seen a retracement, suggesting a possible pullback.

No clear reversal patterns are visible in the latest candles, urging caution for a bullish re-entry.

The presence of consecutive red candles indicates a short-term bearish correction.

MACD Analysis

The MACD line is below the Signal line, reflecting a bearish crossover and weakening momentum.

The histogram is negative and further declining, reinforcing the bearish momentum evident in the market.

No apparent divergence between MACD and price action supports the prevailing bearish sentiment.

Volume Analysis

Volume shows gradual fluctuations with no significant spikes recently.

Moderately low volume during the downward move may suggest a typical pullback rather than a major reversal.

Continued low volume could imply lack of buyer interest in reversing current trends.

Support & Resistance

The 1.1800 level presents a potential support zone where stabilization or reversal could occur.

Resistance is observed near the 1.2100 level, coinciding with the recent peak.

Monitoring these levels can provide clues on future price movements and trading opportunities.

Actionable Insights

Given the current bearish indicators, adopting a hold or cautious stance is advisable unless bullish indicators appear.

Watch for signs of reversal such as bullish candlestick formations or volume surges at support levels for potential entry points.

Remain cautious around support zones; a break below 1.1800 with volume could suggest further downside potential.

The AI Technical Analysis Center is an informational tool only and does not constitute investment or trading advice.
This site is registered on wpml.org as a development site. Switch to a production site key to remove this banner.