February 17, 2026 08:03
The chart for Asset shows notable price movements and patterns. Clear trends are visible with potential areas of interest for traders. Asset is currently in focus due to these technical indicators.
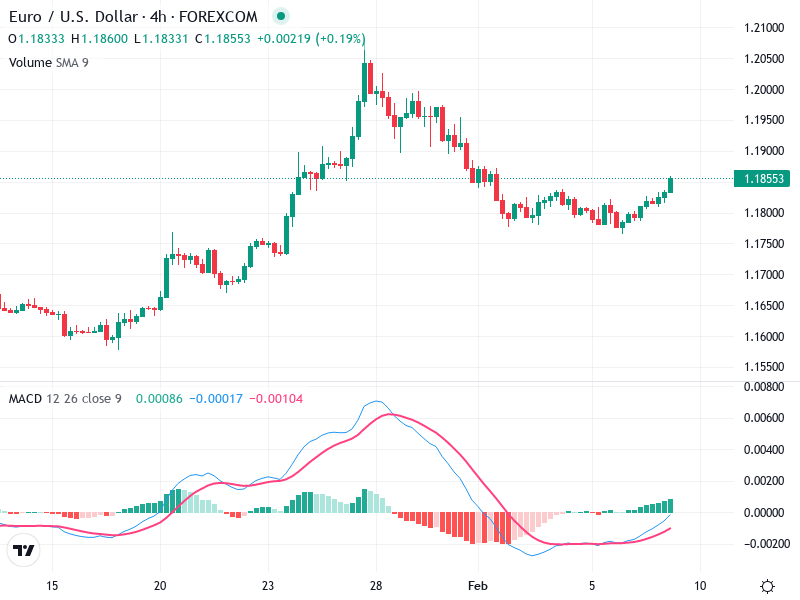
The chart shows a bullish trend initially, followed by a retracement. Notable patterns include potential bullish engulfing around the end of the downtrend.
The overall trend was initially bullish with a breakout upwards, followed by a clear downward pullback, and currently appears to be recovering and moving sideways to bullish.
The price initially broke out upwards around mid-January but pulled back from the peak near 1.20500. Recent price action suggests a possible recovery from the pullback.
The MACD line is crossing above the Signal line, suggesting a bullish crossover.
The histogram is moving towards positive territory, indicating increasing bullish momentum which supports the bullish sentiment.
There doesn't appear to be a clear divergence between MACD and price action indicating an alignment with the current price trend.
Volume increased during the initial bullish breakout, supporting the upward price movement. The current volume appears relatively average without significant spikes.
Current rise in price is not backed by a significant increase in volume, which might indicate hesitance in the market.
No unusual volume spikes are visible at the moment, suggesting a lack of strong institutional activity.
Key support appears to be around 1.17500, which has held during the pullback.
Resistance is near the recent highs around 1.20000–1.20500, where previous attempts have failed.
Consider buying if price consolidates above 1.19000 with supportive volume.
Be cautious near the 1.20000–1.20500 resistance area unless a clear breakout occurs.
Holding might be advisable for those already long, provided the bullish momentum continues and price stays above 1.17500.