Generic selectors
Exact matches only
Search in title
Search in content
Post Type Selectors

Popular stocks

Crypto

CFD

Currencies

Support

Gold

EUR/USD – Technical Analysis – 4h

February 24, 2026 08:02

Quick Summary

The EUR/USD 4-hour chart shows a prevailing downtrend. The pair has recently displayed consolidation and sideways movement. Traders should note the importance of support and resistance levels depicted on the chart.

Candlestick Analysis

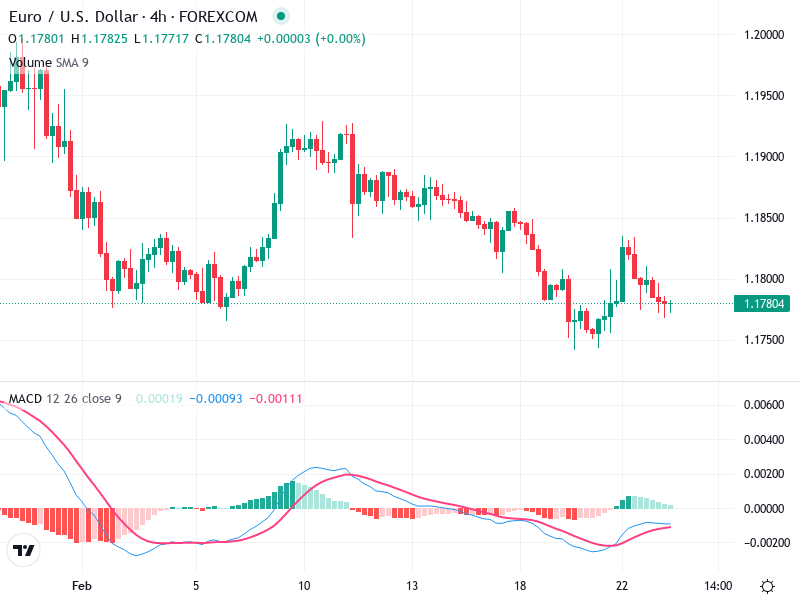
The EUR/USD has been predominantly in a downtrend, marked by a series of lower highs and lower lows. Recently, the price consolidated slightly with sideways movements.

There's no clear significant candlestick reversal pattern such as a bullish engulfing or hammer visible in the most recent candles. However, the preceding small-bodied candles could indicate indecision among traders.

The price appears to be consolidating just above the 1.1780 level, suggesting potential support, which might act as a pullback zone.

MACD Analysis

The MACD line is slightly above the signal line after a recent bullish crossover, indicating a rebound in momentum but with weak strength.

The histogram is slightly above zero but is decreasing, suggesting a loss of bullish momentum or possible upcoming lateral movement.

There is no clear divergence between the MACD and the price action, confirming that the momentum reflects the price trend.

Volume Analysis

The volume is relatively stable with no significant spikes.

The lack of increased volume on recent upward movements indicates weak buying pressure.

No notable unusual volume spikes suggest the lack of significant institutional activity at present.

Support & Resistance

The price has found near-term support around the 1.1750 level, where it has rebounded previously.

The 1.1850 level is a critical resistance zone potentially capping upward movements. A breakout above this could signal bullish momentum.

Monitoring these levels is essential for anticipating potential breakouts or reversals.

Actionable Insights

Consider entering long positions if there's a confirmed breakout above 1.1850 with strong volume to support momentum.

A break below 1.1750 with increased volume could be an opportunity for short positions, anticipating further downside.

Currently, holding is advisable until clearer signals or breakouts occur, given the recent lack of strong directional movement.

The AI Technical Analysis Center is an informational tool only and does not constitute investment or trading advice.
This site is registered on wpml.org as a development site. Switch to a production site key to remove this banner.