Generic selectors
Exact matches only
Search in title
Search in content
Post Type Selectors

Popular stocks

Crypto

CFD

Currencies

Support

Gold

EUR/USD – Technical Analysis – 4h

March 4, 2026 08:02

Quick Summary

The asset is experiencing a mix of signals suggesting potential changes in direction. Recent chart observations highlight key resistance and support levels, as well as candlestick patterns indicating possible reversals.

Overall, the technical indicators display mixed sentiments, providing traders with potential actionable insights.

Candlestick Analysis

Recently, there appears to be a bullish candlestick formation suggesting a potential reversal.

Preceding it are bearish candlesticks indicating a strong downtrend.

The price attempted to pull back near the 1.1650 level but was unable to surpass it, marking it as a potential resistance zone.

MACD Analysis

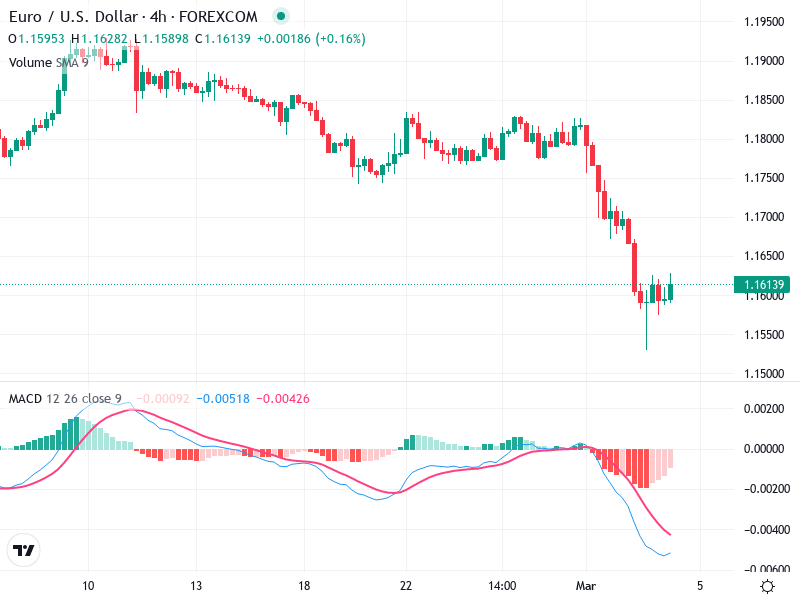
The MACD line is below the Signal line, which typically suggests a bearish environment.

Both lines are turning upwards, hinting at a potential crossover.

The histogram shows increasing positive momentum, indicating the downtrend may be losing strength.

Volume Analysis

There is a noticeable spike in volume during the recent reversal attempt, suggesting increased interest or institutional activity.

The increased volume on the reversal candle supports a potential change in trend or consolidation phase.

This suggests possible emerging market participation.

Support & Resistance

The area around 1.1550 appears to be a strong support level where the price recently rebounded.

The 1.1650 level is acting as immediate resistance; a break above it could indicate further bullish momentum.

These levels must be closely watched for any potential breakout.

Actionable Insights

Consider buying if the price manages to break above the 1.1650 resistance level with volume confirmation.

Look for confirmation through MACD crossover or additional bullish candlestick patterns.

Potential sell opportunity if the price fails to rise above resistance and drops below the recent support level of 1.1550 with strong bearish volume.

The AI Technical Analysis Center is an informational tool only and does not constitute investment or trading advice.
This site is registered on wpml.org as a development site. Switch to a production site key to remove this banner.