September 25, 2025 12:04
The chart reveals intriguing patterns signaling potential shifts in market direction. Close examination of recent trends suggests that this asset is at a pivotal point.
Traders should pay attention as the asset approaches essential support and resistance levels that could influence future price movements.
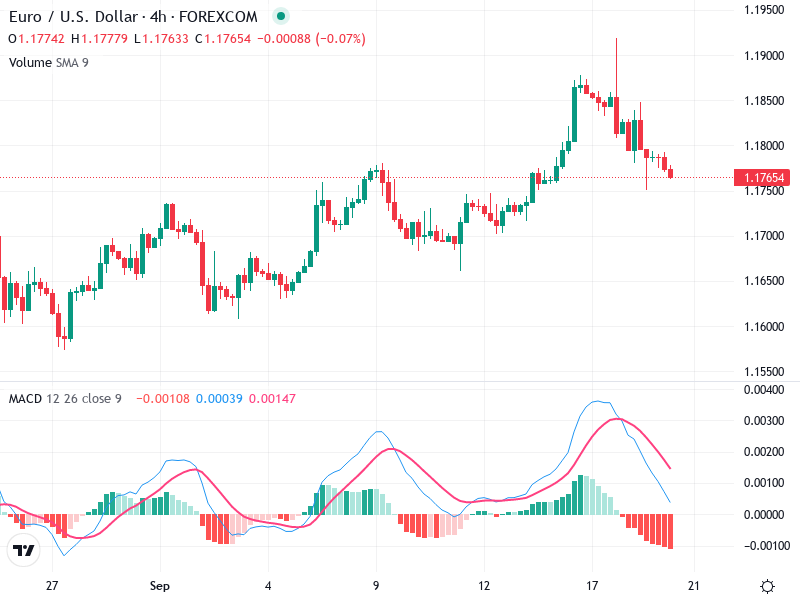
Recently, there is a bearish engulfing pattern observed after a strong upward movement. This pattern indicates potential reversal from the bullish trend.
The current trend shows a shift from bullish to bearish, as evident from the lower highs and lower lows beginning to form.
The price is near a potential pullback zone around 1.1760. A break below this level could lead to further decline.
The MACD line is below the Signal line, indicating a bearish crossover. This signals potential continuing downward momentum.
The histogram bars are in the negative, suggesting increasing bearish momentum.
No significant divergences between MACD and price action currently observed.
Although volume data is limited, there is no indication of a significant volume spike, which would typically indicate strong market interest.
The declining volume on recent price drops suggests a less convincing bearish sentiment without strong seller conviction.
No unusual volume spikes are observed that could indicate institutional activity.
Immediate support is around 1.1750-1.1760. A break below could lead to further declines toward 1.1700.
Resistance is around the recent high near 1.1850. A push above this level would suggest a resumption of the bullish trend.
If the price breaks below the 1.1750 level on strong volume, consider selling targets around 1.1700.
If the price stabilizes and shows signs of reversal, potential buying opportunities may arise, especially above 1.1850.
Monitor for a confirmed move below current support or a reversal pattern indicating the resumption of an uptrend.