Generic selectors
Exact matches only
Search in title
Search in content
Post Type Selectors

Popular stocks

Crypto

CFD

Currencies

Support

Gold

EUR/USD – Technical Analysis – 4h

September 25, 2025 07:02

Quick Summary

The EUR/USD 4-hour chart shows a predominantly bearish trend in the short term.

The analysis highlights significant patterns and potential breakout zones.

Candlestick Analysis

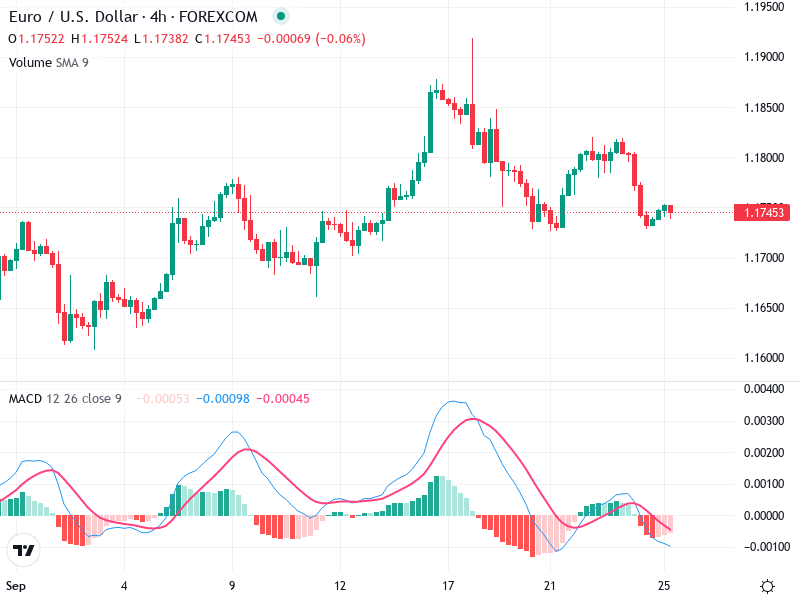
The overall trend appears to be bearish in the short term, with a noticeable downtrend from the mid-point of the chart.

There was a bullish spike at the beginning, marked by strong green candles reaching a peak around mid-September.

Recently, a series of bearish candles indicates selling pressure, with no immediate strong reversal patterns like hammers or engulfing candles present.

MACD Analysis

The MACD line is below the Signal line, suggesting bearish momentum. A bearish crossover occurred recently.

The MACD histogram shows increasing bearish momentum, as indicated by the deepening red bars.

There might be a slight bullish divergence forming as the price makes a lower low, but the histogram is not confirming this with lower highs; it requires monitoring.

Volume Analysis

Volume appears relatively consistent throughout the chart, with no extreme spikes that would indicate substantial institutional activity.

The lack of volume spikes during the latest move down suggests it might not be a strong conviction move.

Monitoring volume for any significant changes will be important in confirming moves.

Support & Resistance

Current support is near the price of 1.1700, which aligns with previous low points on the chart.

Major resistance is around 1.1850, where the price previously peaked before declining.

These levels are crucial for determining potential entry and exit points.

Actionable Insights

Consider a short position if the price breaks below the 1.1700 support level, especially if accompanied by increased volume.

Hold positions until a clearer signal, such as a bullish reversal pattern or significant volume change, appears.

Watch for a potential reversal pattern or a bullish divergence on the MACD for an indication of a trend change.

The AI Technical Analysis Center is an informational tool only and does not constitute investment or trading advice.
This site is registered on wpml.org as a development site. Switch to a production site key to remove this banner.