Generic selectors
Exact matches only
Search in title
Search in content
Post Type Selectors

Popular stocks

Crypto

CFD

Currencies

Support

Gold

EUR/USD – Technical Analysis – 4h

September 29, 2025 07:03

Quick Summary

The asset’s chart indicates a potential upward movement with recent signals suggesting a shift from previous trends. Analyzing technical indicators offers insights into market sentiment and possible future directions for the asset.

Volume changes and significant patterns provide further highlights of potential buying interest at key levels.

Candlestick Analysis

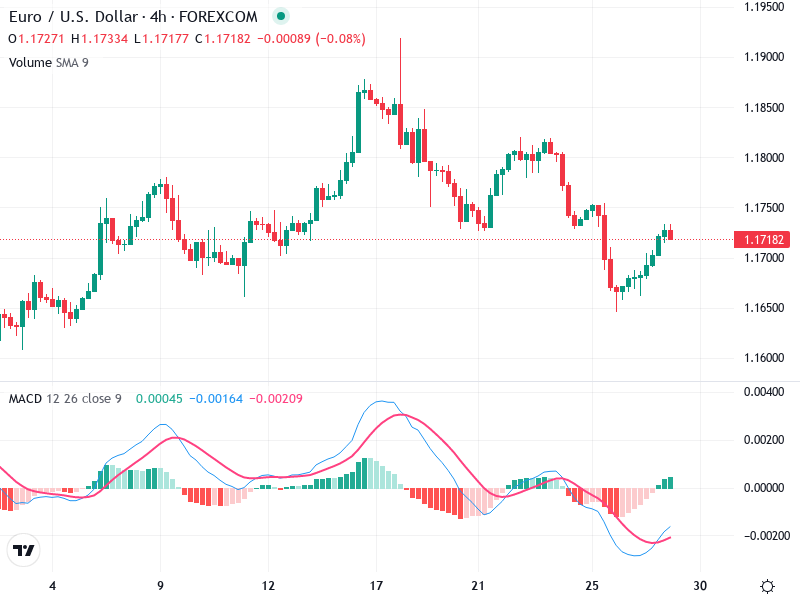
The chart shows a recent bullish reversal pattern with a series of bullish candlesticks forming after a downtrend, indicating potential upward momentum.

Notably, there is a hammer pattern around the lowest point, suggesting a reversal.

There is a noticeable pullback near the 1.16500 level before the rise, signaling it as a potential support zone.

MACD Analysis

The MACD line has recently crossed above the Signal line, indicating a bullish crossover, which suggests increasing positive momentum.

The MACD histogram is showing positive values, which reinforces the bullish sentiment.

No clear divergence is observed between the MACD and price action, suggesting alignment between them.

Volume Analysis

Volume has spiked during the recent upward movement, which supports the price increase, indicating strong buying interest.

Unusual volume spikes could suggest possible institutional buying, reinforcing the bullish outlook.

The overall increase in volume during upward trends supports the asset's strength.

Support & Resistance

Key support is around the 1.16500 level, which held firm during the recent pullback.

Resistance is visible around 1.18500, where the previous upward movement faced selling pressure.

Monitoring these levels can provide guidance for potential entry or exit points in trades.

Actionable Insights

Consider buying near the support level (1.16500) if the price action shows further bullish confirmations, such as a continuation pattern.

Watch for potential sell signals or resistance near 1.18500 if the price struggles to break above this level.

Hold if you have positions from lower levels and wait for a decisive break above the resistance to add more.

The AI Technical Analysis Center is an informational tool only and does not constitute investment or trading advice.
This site is registered on wpml.org as a development site. Switch to a production site key to remove this banner.