Generic selectors
Exact matches only
Search in title
Search in content
Post Type Selectors

Popular stocks

Crypto

CFD

Currencies

Support

Gold

EUR/USD – Technical Analysis – 4h

September 30, 2025 07:02

Quick Summary

The EUR/USD 4-hour chart exhibits a potential shift in market sentiment. A recent bullish engulfing pattern suggests a change from the previous downtrend, possibly moving towards sideways momentum. Traders should observe key levels for future directional signals.

Candlestick Analysis

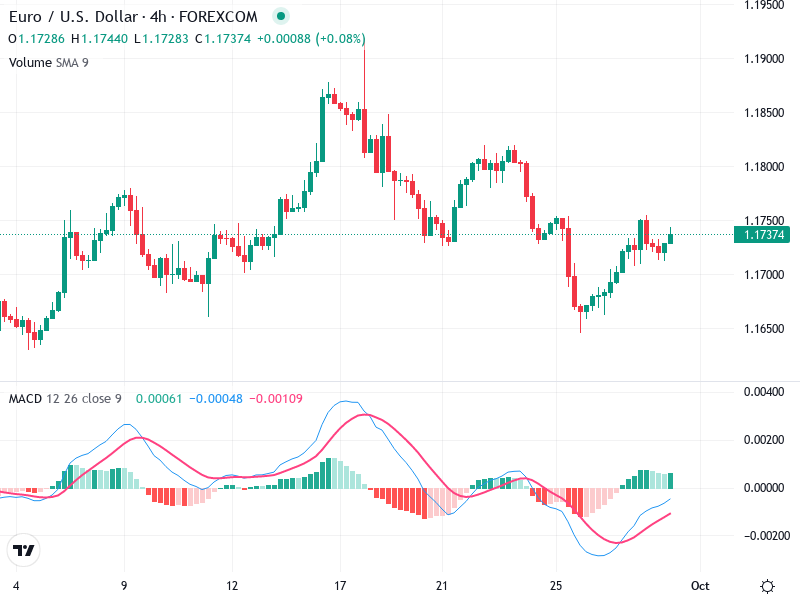
A bullish engulfing pattern can be spotted around the mid-September lows, indicating a potential reversal from the previous downtrend.

A series of smaller bodied candles recently indicates indecision, suggesting potential consolidation or a pause before the next move.

The pair was in a downtrend through mid-September, but the presence of the bullish engulfing indicates a possible shift to a more sideways movement.

MACD Analysis

The MACD line is crossing above the Signal line, indicating a bullish crossover, which is generally a positive sign for upward momentum.

The histogram is showing increasing positive bars, suggesting strengthening bullish momentum.

No significant MACD divergence is currently observed between price action and the MACD.

Volume Analysis

Average volume appears stable. There are no significant spikes currently which might indicate a substantial change in trend direction.

Volume does not show any unusual activity to contradict the price movements, aligning with the current price consolidation.

The lack of significant volume spikes suggests a continuation of current trend directions until further notice.

Support & Resistance

Key support level is around 1.1680. If price falls to this level, it might find buying interest.

Strong resistance is identified around 1.1750, which coincides with a recent high. A breakout above this could indicate continuation of upward momentum.

Monitoring these levels can provide insight into potential market movements in the coming sessions.

Actionable Insights

If the price breaks and closes above 1.1750 with increased volume, consider a long position targeting previous highs around 1.1800.

If price reverses and breaks below 1.1680 support, consider a short position targeting 1.1600.

Bullish confirmation if the price breaks past 1.1750. Watch for increased volume to validate the breakout.

The AI Technical Analysis Center is an informational tool only and does not constitute investment or trading advice.
This site is registered on wpml.org as a development site. Switch to a production site key to remove this banner.