Generic selectors
Exact matches only
Search in title
Search in content
Post Type Selectors

Popular stocks

Crypto

CFD

Currencies

Support

Gold

EUR/USD – Technical Analysis – 4h

October 1, 2025 07:02

Quick Summary

The EUR/USD 4-hour chart shows a potential shift from a previous downtrend. The recent bullish indicators suggest a recovery and possible bullish sentiment. Key levels of support and resistance are crucial for future price action.

Candlestick Analysis

A bullish engulfing pattern appears around September 25th, indicating potential bullish momentum.

The chart shows a recovery from a previous downtrend. The recent pattern suggests a potential shift towards bullish sentiment.

The level around 1.177 has been retested, acting as a resistance, which is now a zone to watch for potential breakouts.

MACD Analysis

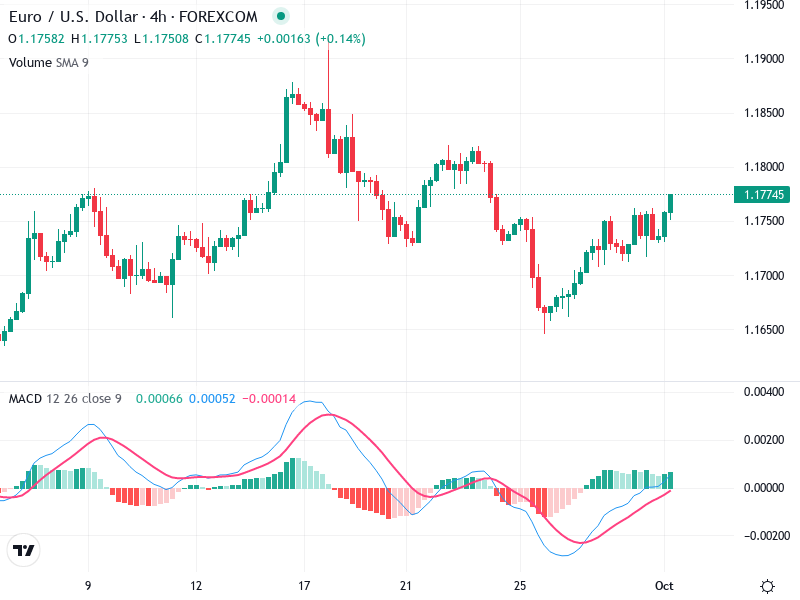
Currently, the MACD line is above the Signal line, indicating a bullish crossover that suggests increasing upward momentum.

The histogram shows positive values, confirming the bullish momentum. It’s important to monitor for any shortening of the bars which could indicate a decrease.

There are no clear divergences between the MACD and price action at this time, maintaining consistency with bullish sentiment.

Volume Analysis

Volume seems relatively stable with occasional spikes. The volume spike near the bullish engulfing pattern likely indicates institutional buying or increased trader interest.

Increasing price on stable or slightly increasing volume suggests a healthy bullish movement, though continued volume support is crucial for sustained trends.

The chart suggests improving sentiment toward a bullish side. However, staying cautious around resistance levels is prudent.

Support & Resistance

Key support around 1.170, where previous consolidation occurred before the upward move.

Current resistance is around 1.177-1.180, where the price has repeatedly tested.

Monitor for a break or retest of the resistance at 1.177-1.180. A failure to break could suggest a pullback.

Actionable Insights

Consider buying on a confirmed breakout above 1.180 with increasing volume and strong bullish candles.

Monitor for a break or retest of the resistance at 1.177-1.180. A failure to break could suggest a pullback.

Watch for any bearish signals if candles show weakness or if the MACD begins to converge towards a bearish crossover.

The AI Technical Analysis Center is an informational tool only and does not constitute investment or trading advice.
This site is registered on wpml.org as a development site. Switch to a production site key to remove this banner.