Generic selectors
Exact matches only
Search in title
Search in content
Post Type Selectors

Popular stocks

Crypto

CFD

Currencies

Support

Gold

EUR/USD – Technical Analysis – 4h

October 2, 2025 07:03

Quick Summary

The EUR/USD chart displays a pattern of gradual recovery following a noticeable downturn. The asset shows signs of potential bullish momentum, albeit with periods of indecision marked by doji patterns. Upcoming movements may hinge on MACD developments and volume trends.

Candlestick Analysis

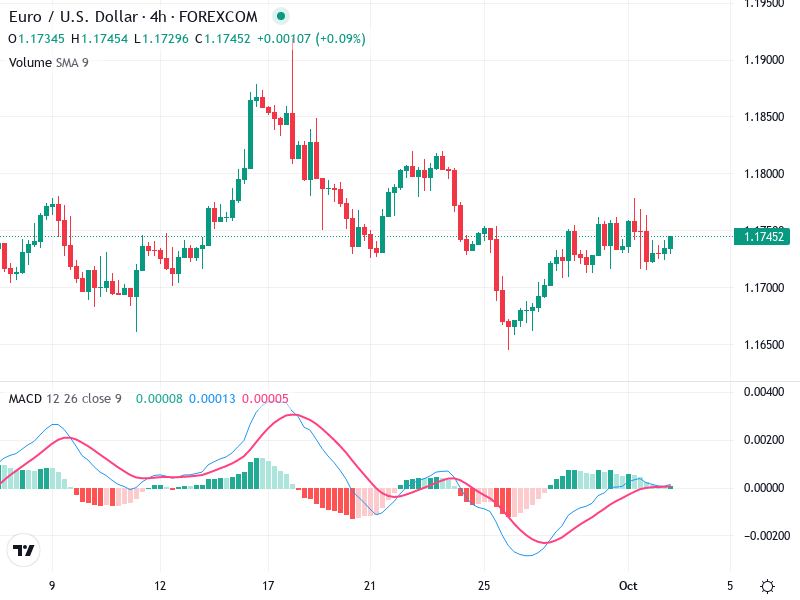
Instances of bullish engulfing patterns suggest potential reversals after downtrends, seen in mid-September.

A doji pattern appears, indicating market indecision, noted in mid-late September.

The overall trend remains sideways with fluctuations, transitioning to a recovery pattern at September's end.

MACD Analysis

A recent bullish crossover occurs as the MACD line crosses above the signal line, signaling potential bullish momentum.

Shrinking positive histogram bars could suggest weakening bullish momentum.

No significant divergences are noted, but waning momentum is suggested by the current setup.

Volume Analysis

Volume spikes align with price reversals and trends, with notable drops following a sharp price decrease.

Increased volume supports upward momentum towards the end of September, confirming buyer interest.

Occasional volume spikes might indicate institutional activity or reactions to news events, especially during trend reversals.

Support & Resistance

Key support identified around 1.1700, demonstrated by repeated bounces at this level.

Resistance is apparent near 1.1830, where upward breaks struggle to sustain.

The close tests around these levels reflect pivotal points for future movements.

Actionable Insights

Consider entering a buy position on confirmation of a bullish reversal with a close above 1.1830, ideally supported by increased volume and MACD momentum.

Watch for a bearish MACD crossover or break below the 1.1700 support zone with rising volume to validate bearish sentiment.

If long from lower levels, observe a breach above 1.1830 for additional confirmation.

The AI Technical Analysis Center is an informational tool only and does not constitute investment or trading advice.
This site is registered on wpml.org as a development site. Switch to a production site key to remove this banner.