Generic selectors
Exact matches only
Search in title
Search in content
Post Type Selectors

Popular stocks

Crypto

CFD

Currencies

Support

Gold

EUR/USD – Technical Analysis – 4h

August 26, 2025 07:02

Quick Summary

The EUR/USD 4h chart exhibits interesting dynamics as it moves within a sideways trend. Recent volatility has tapered off into consolidation, indicating a significant phase in the currency pair’s performance. Close monitoring of support and resistance levels could offer insights into future moves.

The pair is navigating a critical range, with key levels that may determine upcoming price direction, offering potential buy and sell triggers for traders.

Candlestick Analysis

The overall trend appears to be sideways with a slight bearish inclination, reflecting some consolidation after recent volatility.

There is a potential bearish engulfing pattern in the recent price action, indicating potential future bearish momentum.

The presence of several small-bodied candles suggests market indecision.

MACD Analysis

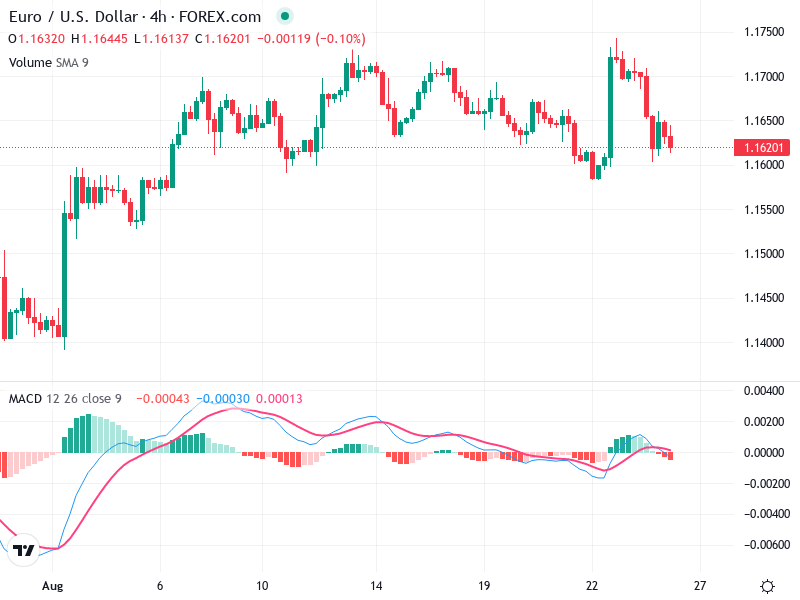
The MACD line is slightly below the Signal line, suggesting a mild bearish crossover.

The histogram is showing decreasing positive momentum, indicating weakening bullish momentum.

No clear divergence observed between MACD and price action, but the bearish crossover may suggest increased selling pressure.

Volume Analysis

Recent trading volumes are relatively stable, with no significant spikes indicating institutional activity.

The lack of volume spikes during price drops could mean that the downward move isn't heavily supported by strong selling pressure.

Traders should remain cautious amid stable volumes, as these conditions suggest uncertainty in market conviction.

Support & Resistance

Key support at around 1.1600. A break below could see a sharper decline.

Resistance is present at 1.1700. A breach above this level could target higher price zones.

Monitoring these levels closely may provide opportunities for strategic entries or exits.

Actionable Insights

Consider buying if the price breaks and closes above 1.1700 with strong volume, suggesting bullish momentum.

A short position could be favorable if the price breaks below 1.1600 with significant volume, indicating further downside.

The current sideways trend suggests a hold strategy until a clear breakout in either direction confirms.

The AI Technical Analysis Center is an informational tool only and does not constitute investment or trading advice.
This site is registered on wpml.org as a development site. Switch to a production site key to remove this banner.