Generic selectors
Exact matches only
Search in title
Search in content
Post Type Selectors

Popular stocks

Crypto

CFD

Currencies

Support

Gold

EUR/USD – Technical Analysis – 4h

October 9, 2025 07:02

Quick Summary

The EUR/USD 4-hour chart displays a mostly bearish trend with signs of potential short-term bounce.

Key levels of support and resistance are evident, influencing price movements.

Indicators show mixed signals suggesting a need for cautious trading.

Candlestick Analysis

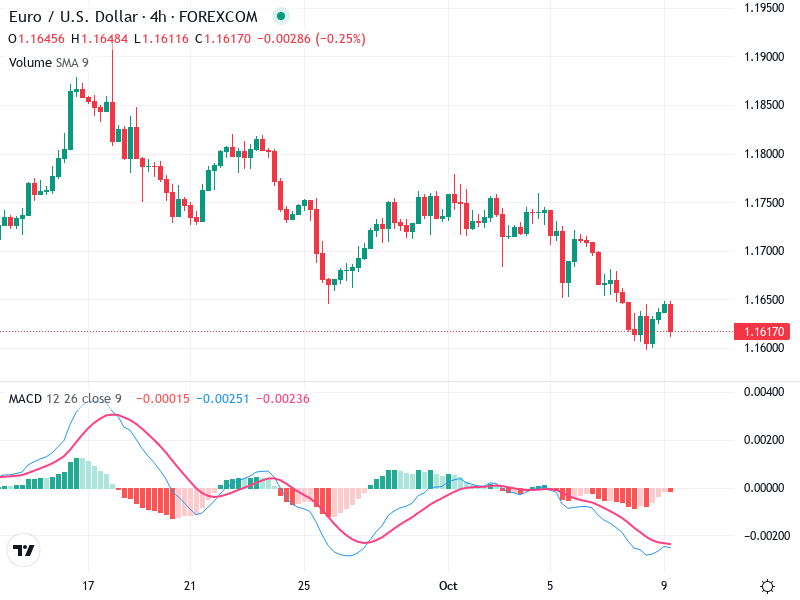
Recent candlesticks show a slight reversal near the October low, with a potential hammer-like candle indicating some buying interest at lower levels.

The chart shows a bearish trend with lower highs and lower lows, suggesting a possible short-term consolidation or pullback.

The area around 1.1600 to 1.1615 acts as a support, with resistance around 1.1700 presenting a breakout/pullback zone.

MACD Analysis

The MACD line is slightly above the Signal line, indicating a recent bullish crossover, but close proximity to the neutral zone suggests weak momentum.

The histogram shows a slight increase in bullish momentum, but it remains relatively flat.

No clear divergence is evident between the MACD and price action currently.

Volume Analysis

There is no significant spike in trading volume, indicating that recent price moves might lack strong conviction.

Low volume does not strongly support the small bullish bounce, suggesting caution for bulls.

No unusual volume spikes suggest institutional activity at this moment.

Support & Resistance

Key support is noted around the 1.1600 level, which has been tested recently.

Resistance is present near 1.1700, aligning with recent highs.

A break below 1.1600 could signal further downside, while a break above 1.1700 could initiate a stronger bullish retracement.

Actionable Insights

Consider buying if the price confirms a reversal pattern above 1.1650 with increasing volume and a stronger MACD rise.

Selling could be considered if the price breaks firmly below 1.1600 with confirming bearish signals on the MACD.

Hold if the price remains within the 1.1600 to 1.1700 range without clear directional bias.

The AI Technical Analysis Center is an informational tool only and does not constitute investment or trading advice.
This site is registered on wpml.org as a development site. Switch to a production site key to remove this banner.