Generic selectors
Exact matches only
Search in title
Search in content
Post Type Selectors

Popular stocks

Crypto

CFD

Currencies

Support

Gold

EUR/USD – Technical Analysis – 4h

October 13, 2025 07:02

Quick Summary

The EURO / U.S. Dollar chart over a 4-hour period shows notable patterns and indicators providing insights into its recent performance. The observed trends and indicators suggest potential bullish momentum, making it crucial to monitor key resistance and support levels.

Current sideways movement highlights market indecision, indicating traders should await confirmation before making significant trading decisions.

Candlestick Analysis

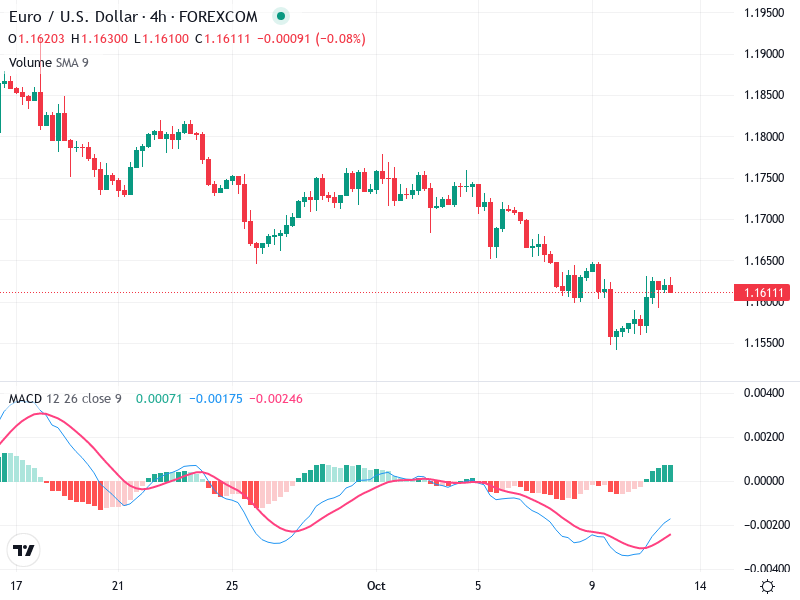
A noticeable bullish candlestick pattern emerged recently, resembling a small bullish engulfing pattern, indicating potential upward momentum after a downtrend.

The chart shows a recent formation similar to a hammer, which usually appears at the bottom of a downtrend, suggesting a possible reversal.

Currently, there appears to be a short-term sideways movement, indicating uncertainty and potential consolidation.

MACD Analysis

There’s been a recent bullish crossover where the MACD line has risen above the Signal line, indicating potential bullish momentum.

Positive bars on the histogram are growing, suggesting increasing bullish momentum.

No significant divergences observed at this time, as price and MACD trends are generally aligned.

Volume Analysis

No significant changes in volume indicating a major trend shift; volume appears average and steady.

Current volume does not contradict recent price movements; it is modest and suggests consolidation.

No unusual spikes indicating major institutional activity; thus, the recent movement may not be driven by large players.

Support & Resistance

Key support is identified around 1.1560, close to recent lows.

Immediate resistance is at approximately 1.1650, where recent highs have struggled to break.

A firm break above resistance or below support could define the next directional bias.

Actionable Insights

Consider a buy if the price breaks above 1.1650 with increased volume.

Consider a sell if the price falls below 1.1560 with confirming bearish signals.

Monitor for confirmation of MACD bullish signals and watch for any significant volume spikes that could indicate a new trend direction.

The AI Technical Analysis Center is an informational tool only and does not constitute investment or trading advice.
This site is registered on wpml.org as a development site. Switch to a production site key to remove this banner.