Generic selectors
Exact matches only
Search in title
Search in content
Post Type Selectors

Popular stocks

Crypto

CFD

Currencies

Support

Gold

EUR/USD – Technical Analysis – 4h

October 14, 2025 07:02

Quick Summary

The analysis of the asset highlights key technical indicators that are crucial for traders. The candlestick patterns, MACD, and volume provide insights into the potential direction of the asset’s price movement. Understanding support and resistance levels is essential for making informed trading decisions.

Candlestick Analysis

The overall trend appears bearish with lower highs and lower lows.

There are no strong bullish reversal patterns like a bullish engulfing or hammer visible at this point. The sequence of red candles suggests continued selling pressure.

A potential pullback zone is around 1.16500 where price previously hesitated. Current price action suggests testing support.

MACD Analysis

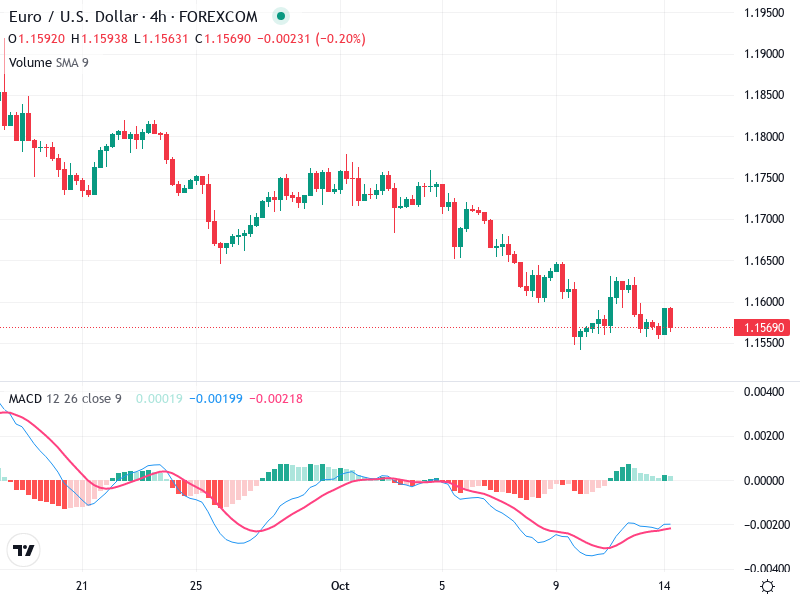
The MACD line is slightly above the Signal line, indicating a recent bullish crossover.

The histogram shows narrowing, suggesting weakening bearish momentum, but it remains in negative territory.

No significant bullish or bearish divergences between MACD and price action observed.

Volume Analysis

Volume shows spikes during price drops, indicating selling pressure.

The lack of strong volume on up moves suggests reluctance or lack of confidence among buyers.

No unusual volume spikes that would suggest sudden institutional interest.

Support & Resistance

Around 1.16500 acts as near-term resistance where price struggled to break higher.

Immediate support can be seen at 1.15500. A break below could intensify the bearish trend.

Monitoring these levels will be crucial for understanding future price movements.

Actionable Insights

Monitoring the price action near the support level of 1.15500 is crucial. A confirmed break below this level might indicate a sell opportunity.

Look for confirmation of trend reversal near resistance at 1.16500 if considering any buy signals—particularly bullish candlestick patterns or volume increase.

Continued monitoring needed for any reversal signals or unusual volume patterns which could affect market direction.

The AI Technical Analysis Center is an informational tool only and does not constitute investment or trading advice.
This site is registered on wpml.org as a development site. Switch to a production site key to remove this banner.