Generic selectors
Exact matches only
Search in title
Search in content
Post Type Selectors

Popular stocks

Crypto

CFD

Currencies

Support

Gold

EUR/USD – Technical Analysis – 4h

October 29, 2025 08:03

Quick Summary

The EUR/USD chart currently presents a sideways market pattern, indicating consolidation at current levels.

Recent analysis shows potential price action changes that traders should watch closely.

Candlestick Analysis

The chart depicts a sideways trend after a brief bullish run, suggesting consolidation around the current levels.

There is a small bearish candle forming, which could indicate potential bearishness, but confirmation is needed.

No dominant bullish or bearish candlestick patterns are presently visible, indicating indecision in the market.

MACD Analysis

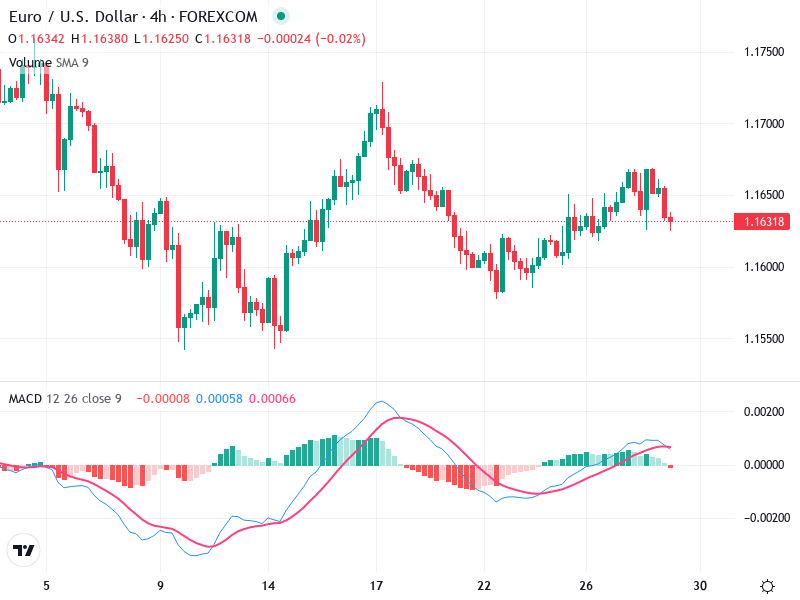
The MACD line appears to have recently crossed above the Signal line, indicating a potential continuation of bullish momentum. However, the lines are converging, with the possibility of a bearish crossover.

The histogram shows diminishing momentum, as evidenced by shorter bars, indicating a slowdown in the upward momentum.

No prominent divergences are observed between the MACD and the price action, maintaining the current trend.

Volume Analysis

Volume remains relatively consistent, with no significant spikes. This suggests that neither bulls nor bears are dominating.

The steady volume supports the sideways movement, without confirming any strong directional bias.

There is no unusual volume activity indicating institutional buying or selling.

Support & Resistance

Key resistance is near the recent high of 1.1700, which has been tested previously.

Immediate support is at 1.1600, with stronger support evident slightly below this level.

These levels are crucial for determining future price action, especially as potential reversal or breakout points.

Actionable Insights

Consider a cautious approach with a potential buying opportunity if the price breaks above 1.1700 with strong volume.

Alternatively, short positions might be considered if the price drops below support with increased selling pressure.

Monitor for a confirmed crossover in the MACD lines and any increase in volume toward the resistance or support level to signal stronger moves.

The AI Technical Analysis Center is an informational tool only and does not constitute investment or trading advice.
This site is registered on wpml.org as a development site. Switch to a production site key to remove this banner.