Generic selectors
Exact matches only
Search in title
Search in content
Post Type Selectors

Popular stocks

Crypto

CFD

Currencies

Support

Gold

EUR/USD – Technical Analysis – 4h

October 30, 2025 08:02

Quick Summary

The EUR/USD chart indicates a sideways trend with potential changes coming. The presence of significant candlestick patterns and support and resistance levels make this chart worth monitoring closely.

Overall, recent developments suggest that traders should prepare for possible bearish movements unless key resistance levels are breached.

Candlestick Analysis

Recently, there appears to be a potential hammer candlestick, suggesting a possible reversal from a downward move.

There is also a series of smaller candlesticks indicating indecision or a sideways trend.

The overall trend has been sideways with noticeable fluctuations. Currently, it shows potential for a bearish continuation if key support levels are breached.

MACD Analysis

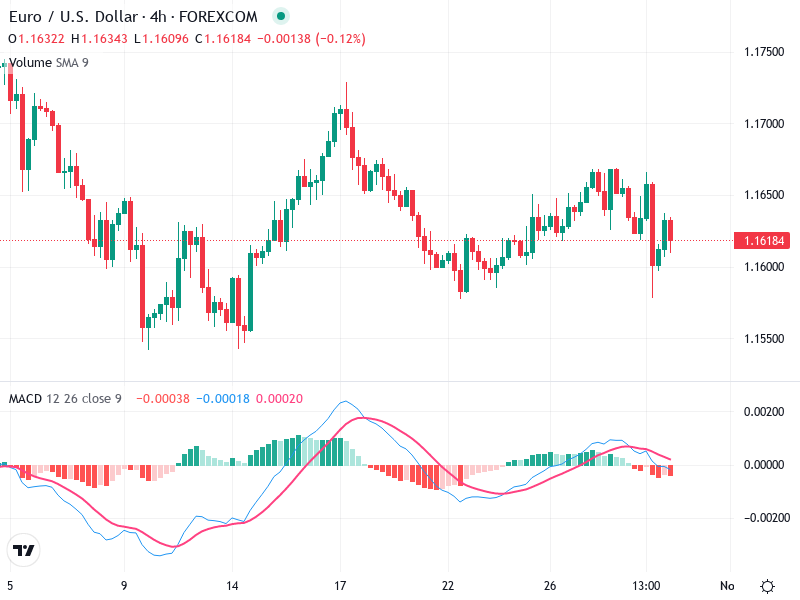
The MACD line is below the Signal line, indicating bearish momentum.

The histogram is currently in negative territory, showing bearish momentum, but it is shrinking, indicating weakening bearish sentiment.

There are no strong divergences currently present between MACD and price action.

Volume Analysis

Volume has been relatively consistent without significant spikes.

A slight increase in volume was noted during the recent price decline, which could signal some selling pressure.

The volume supports recent price declines, suggesting the presence of selling pressure.

Support & Resistance

1.16000 is a critical support level. A breakthrough could lead to further downside.

1.16500 acts as immediate resistance. A breakout above this could initiate a bullish trend.

Watch for breakout above 1.16500 as a potential bullish move. The pullback region around 1.16000 acts as a potential support.

Actionable Insights

Monitor the 1.16000 support. A confirmed break below this level may suggest a short-selling opportunity.

Conversely, a breakout above 1.16500 with volume confirmation could be a buying opportunity.

Look for confirmation signals such as strong candlestick patterns near these key levels or significant changes in volume.

The AI Technical Analysis Center is an informational tool only and does not constitute investment or trading advice.
This site is registered on wpml.org as a development site. Switch to a production site key to remove this banner.