Generic selectors
Exact matches only
Search in title
Search in content
Post Type Selectors

Popular stocks

Crypto

CFD

Currencies

Support

Gold

EUR/USD – Technical Analysis – 4h

August 28, 2025 07:02

Quick Summary

The chart is showing a consolidation phase, with price movements primarily between 1.1550 and 1.1750. This range-bound behavior suggests indecision among traders as they wait for external factors to influence the next major move.

A lack of significant volume changes or pattern formations hints at caution among market participants, indicating they are waiting for more pronounced signals.

Candlestick Analysis

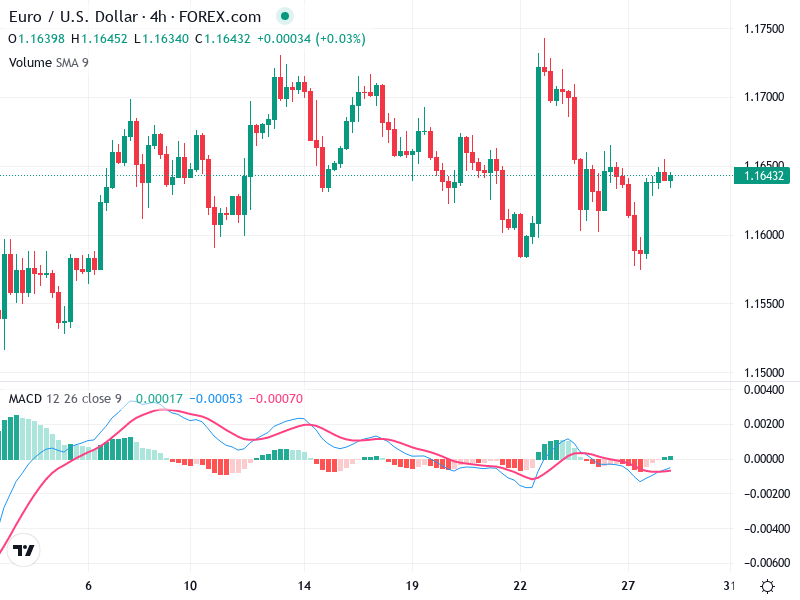
The overall trend appears sideways, suggesting consolidation between the 1.1550 and 1.1750 levels.

Small-bodied candles with longer wicks highlight indecision, typical in sideways trends, with no significant reversal patterns like bullish engulfing or hammers evident.

Current price action near 1.1650 could be a potential breakout point if volume and momentum were to increase.

MACD Analysis

The MACD line is slightly above the Signal line, suggesting a potential bullish crossover, yet the difference is minimal.

The histogram displays small positive bars, indicating weak bullish momentum.

No clear divergence between price action and the MACD supports the idea of ongoing consolidation.

Volume Analysis

Volume remains relatively steady, with no significant spikes indicating major institutional moves.

The lack of strong volume weakens the potential for a sustained breakout or breakdown.

Market participants seem reluctant to commit without more substantial volume confirmation.

Support & Resistance

Support is identified around 1.1550, marking previous low points.

Resistance is near 1.1750, representing recent high points.

These levels are crucial for forecasting future price action, with a break beyond them potentially signaling a new trend.

Actionable Insights

Consider buying if there's a bullish confirmation with increased volume near current levels.

Contemplate selling if the price fails to break resistance or falls back towards support with increasing bearish momentum.

In sideways trends, hold position unless a clear breakout or breakdown emerges.

The AI Technical Analysis Center is an informational tool only and does not constitute investment or trading advice.
This site is registered on wpml.org as a development site. Switch to a production site key to remove this banner.