Generic selectors
Exact matches only
Search in title
Search in content
Post Type Selectors

Popular stocks

Crypto

CFD

Currencies

Support

Gold

EUR/USD – Technical Analysis – 4h

November 3, 2025 08:02

Quick Summary

The EUR/USD chart shows a recent bearish trend with signs of potential consolidation. The asset has demonstrated a weakening in downward momentum, suggesting possible stabilization. Key levels of support and resistance could play a crucial role in determining future price action.

Candlestick Analysis

The EUR/USD chart does not reveal a clear bullish or bearish candlestick pattern, such as a hammer or doji. The previous trend appeared bearish, forming a series of lower highs and lows.

The prevailing trend is bearish, but the chart hints at potential consolidation or reversal near current levels.

The 1.1530 area serves as a pullback zone where stabilization is occurring after a decline.

MACD Analysis

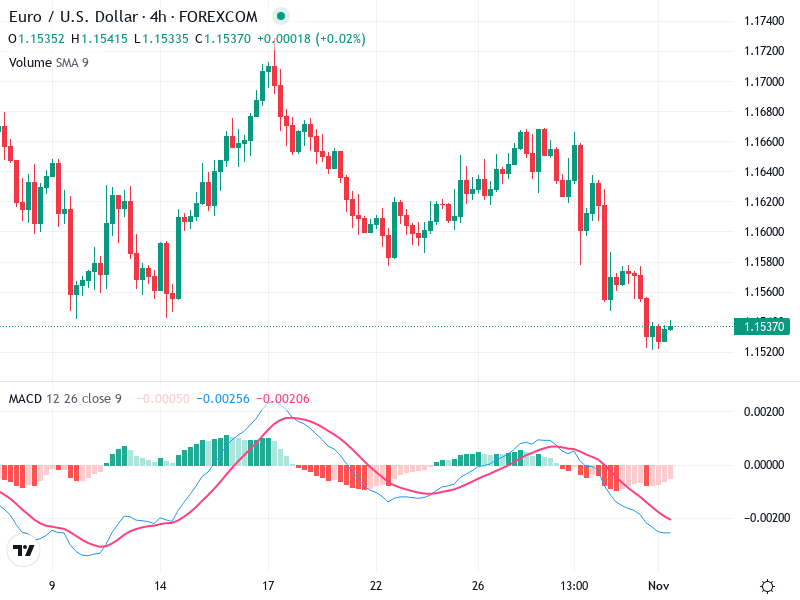
The MACD line crossing below the Signal line indicates a bearish crossover, suggesting ongoing negative momentum.

The MACD histogram is showing diminishing bearish momentum as the bars decrease in size, indicating possible trend weakening or reversal.

No clear divergence is observed between price and the MACD indicator, suggesting the current trend might continue without imminent reversal.

Volume Analysis

Volume has remained relatively steady, showing consistent market activity without overpowering emphasis.

The volume has not strongly supported recent price declines, implying a potential lack of conviction in the downward move.

No unusual volume spikes have been noted, indicating no sudden institutional activity or large trades are present.

Support & Resistance

The 1.1520 level is acting as a critical support zone, where the price seems to consolidate.

Immediate resistance is noted around 1.1580, where upward movements might encounter selling pressure.

Actionable Insights

Considering current signals, it may be prudent to hold or wait for further price direction confirmation.

Monitor for a potential bullish MACD crossover as a buy signal if it occurs.

Watch for breakout or reversal indicators near the support at 1.1520 or resistance at 1.1580.

The AI Technical Analysis Center is an informational tool only and does not constitute investment or trading advice.
This site is registered on wpml.org as a development site. Switch to a production site key to remove this banner.