Generic selectors
Exact matches only
Search in title
Search in content
Post Type Selectors

Popular stocks

Crypto

CFD

Currencies

Support

Gold

EUR/USD – Technical Analysis – 4h

November 6, 2025 08:02

Quick Summary

The EUR/USD 4-hour chart suggests a recovery within a larger bearish context. The pair has shown a series of lower lows, but recent upward movements could hint at a potential reversal. Key levels to watch are around 1.1450 and 1.1550.

Candlestick Analysis

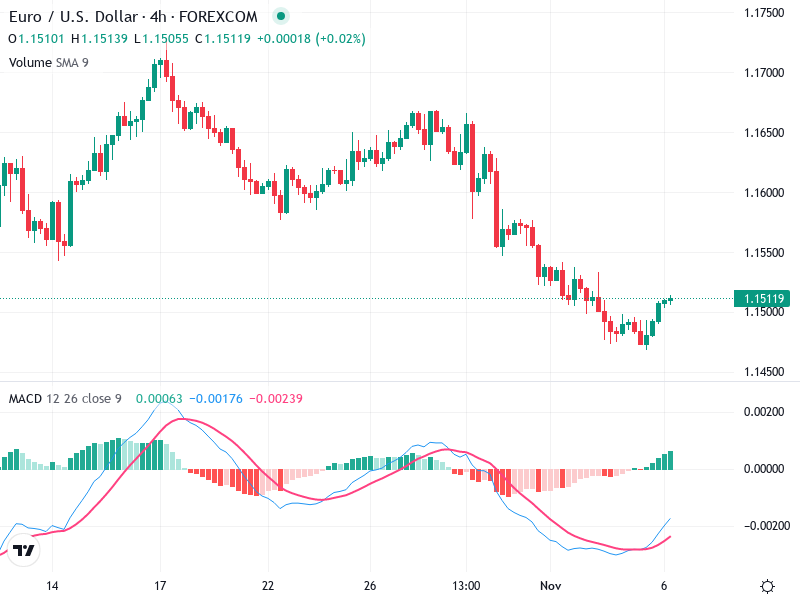
The recent trend appears to be a recovery within a larger bearish context. After a series of lower lows, a potential reversal is indicated by the recent upward price movement.

No major bullish reversal patterns like a hammer or bullish engulfing are observed at the current position, but the clustering of bullish candlesticks suggests building bullish sentiment.

The move past the 1.1500 level could indicate a minor breakout if the price continues upwards, confirming a recovery phase.

MACD Analysis

The MACD line has crossed above the Signal line, indicating a bullish crossover — a positive sign for the momentum change.

The MACD histogram has turned positive, reinforcing the bullish momentum.

There is no clear divergence visible. The MACD’s behavior aligns with the price action, confirming the current trend change.

Volume Analysis

Volume contracted during the decline, and there is a slight increase as the price shows signs of recovery. This increase in volume supports a bullish move.

No significant volume spikes suggestive of heavy institutional involvement at this moment.

While volume has increased, caution is advised until more significant volume trends appear.

Support & Resistance

Key support seems to be around 1.1450, serving as the recent low where the price rebounded.

Immediate resistance is observed around 1.1550. Overcoming this level with sustained volume could fuel further upward movement.

Monitoring these levels will be critical for assessing potential future movements.

Actionable Insights

Consider entering a long position if the price sustains above 1.1550 with increased volume. A stop loss below the recent low at 1.1450 could manage downside risk.

If the price fails to break 1.1550 and reverts with low volume, consider holding current positions or tightening stops to protect gains.

Monitor for confirmation of strength in the next few candles, particularly if accompanied by increased volume, to validate a bullish continuation.

The AI Technical Analysis Center is an informational tool only and does not constitute investment or trading advice.
This site is registered on wpml.org as a development site. Switch to a production site key to remove this banner.