Generic selectors
Exact matches only
Search in title
Search in content
Post Type Selectors

Popular stocks

Crypto

CFD

Currencies

Support

Gold

EUR/USD – Technical Analysis – 4h

August 29, 2025 07:02

Quick Summary

The 4-hour chart of EUR/USD displays critical areas of interest for market participants. A bullish engulfing pattern suggests potential upward movement, while a doji highlights current market indecision. Volume remains steady, aligning with the observed price action.

Support around the 1.1550 level and resistance at 1.1700 play significant roles in shaping future trends. Monitoring these levels can provide insight into potential breakouts or reversals.

Candlestick Analysis

A notable bullish engulfing pattern suggests a potential reversal from the previous downtrend.

Market indecision is indicated by a recent doji near the current price level.

Potential bullish attempts are facing resistance around the 1.1700 level, with support near 1.1550.

MACD Analysis

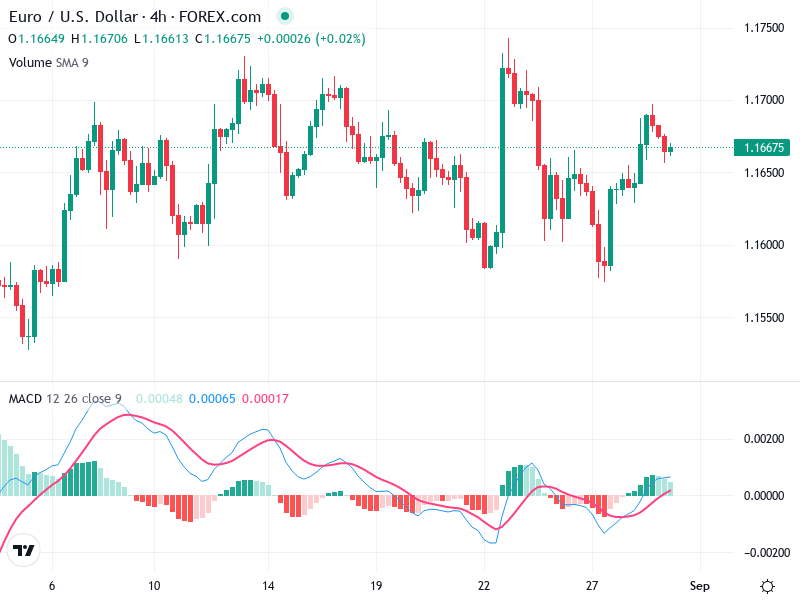
A recent bullish crossover is evident, with the MACD line above the Signal line.

The MACD histogram shows increasing positive bars, indicating strengthening bullish momentum.

No clear divergence between MACD and price action currently supports the ongoing trend.

Volume Analysis

Volume appears stable without extreme spikes, suggesting balanced market activity.

Steady volume during upward price moves validates the bullish sentiment.

No unusual volume spikes indicate a lack of significant institutional moves.

Support & Resistance

Strong support is identified around the 1.1550 level, acting as a potential reversal zone.

Resistance is noted near 1.1700, representing a critical level for a bullish breakout.

Monitoring these levels is key for understanding potential market movements.

Actionable Insights

Consider buying if the price breaks and closes above 1.1700 with increased volume.

A decline below 1.1650 with strong bearish volume could create a selling opportunity targeting 1.1600.

Holding positions may be wise given the current sideways movement, awaiting clearer breakout signals.

The AI Technical Analysis Center is an informational tool only and does not constitute investment or trading advice.
This site is registered on wpml.org as a development site. Switch to a production site key to remove this banner.