Generic selectors
Exact matches only
Search in title
Search in content
Post Type Selectors

Popular stocks

Crypto

CFD

Currencies

Support

Gold

EUR/USD – Technical Analysis – 4h

November 19, 2025 08:02

Quick Summary

The EUR/USD chart shows recent market activity and potential key price levels. There has been a noticeable upward movement followed by consolidation. Currently, the market appears neutral with key support and resistance levels in focus.

Candlestick Analysis

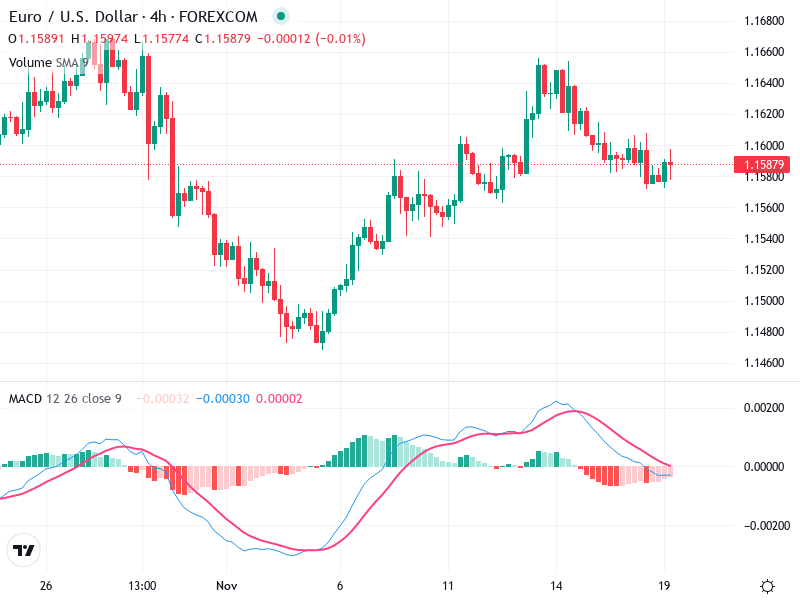
The overall trend appears to have been bullish recently, with a noticeable upward movement followed by a pullback.

There was a bullish run-up in the middle of the chart, potentially indicating a reversal from a prior downtrend. Currently, candlesticks show consolidation behavior suggesting indecision in the market.

The area around 1.16600 served as a resistance where the price declined after reaching it, suggesting it's a key zone to watch for potential breakouts or further pullbacks.

MACD Analysis

The MACD line is below the Signal line, indicating a recent bearish crossover, suggesting potential downward momentum.

The histogram shows diminishing negative values, possibly indicating weakening bearish momentum.

No clear MACD divergence with price action currently observed, as movements have been broadly aligned.

Volume Analysis

There is no significant spike in volume accompanying recent price movements, which suggests lack of strong conviction behind the recent moves.

Limited volume activity suggests that recent price changes may not be strongly supported by broader market participation.

The absence of significant volume changes points to a lack of strong support or resistance confirmation.

Support & Resistance

A key support zone appears to be around 1.15200, where price bounced off previously.

The 1.16600 level has acted as resistance; a break above this may confirm continued bullish momentum.

Monitoring these levels is crucial for determining potential future price movements.

Actionable Insights

Consider buying on a confirmed breakout above 1.16600 with increased volume as it could signal continued upward movement.

A move below the 1.15200 support level with substantial volume could suggest further downside risk, indicating a possible sell.

Currently, with neutral market activity and the absence of strong volume support, a hold strategy could be advisable while waiting for clearer confirmation signals.

The AI Technical Analysis Center is an informational tool only and does not constitute investment or trading advice.
This site is registered on wpml.org as a development site. Switch to a production site key to remove this banner.