Generic selectors
Exact matches only
Search in title
Search in content
Post Type Selectors

Popular stocks

Crypto

CFD

Currencies

Support

Gold

EUR/USD – Technical Analysis – 4h

November 24, 2025 08:02

Quick Summary

The chart shows significant trends and patterns for the asset. It initially shows a bullish trend with signs of reversal.

The analysis provides insights into potential future movements, considering volume and support levels.

Candlestick Analysis

The chart initially shows a bullish trend with higher highs and higher lows, followed by a bearish reversal indicated by lower highs and lower lows in the recent period.

A bearish engulfing pattern is visible where the trend reversed from bullish to bearish.

There is also a potential hammer pattern suggesting recent support around the 1.1500 level.

MACD Analysis

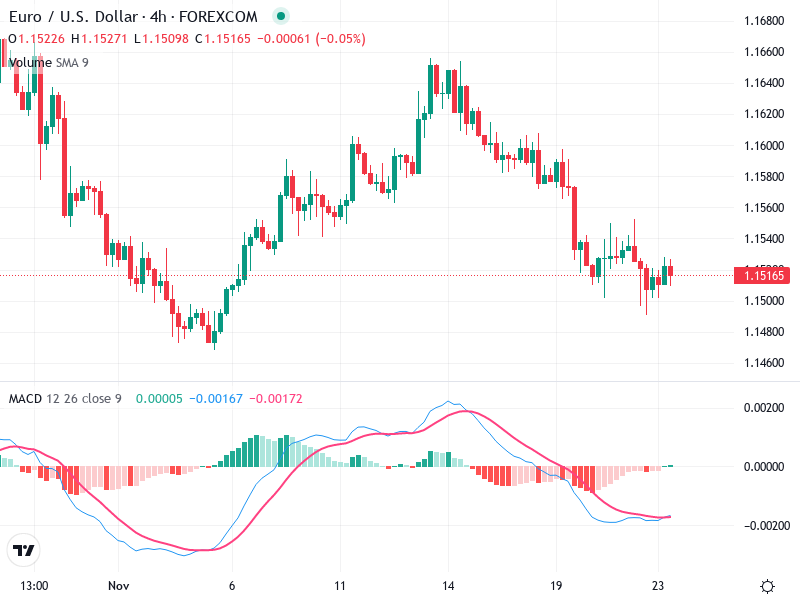
The MACD line is below the Signal line, indicating bearish momentum, but they are converging, suggesting a possible crossover.

The histogram shows decreasing negative momentum, implying a potential weakening of the bearish trend.

There’s a mild bullish divergence as the price makes slightly lower lows while the MACD doesn’t confirm with lower lows, indicating a possible reversal.

Volume Analysis

Volume is relatively low during the current consolidation, suggesting a lack of conviction in either direction.

There are no significant volume spikes indicating strong buying or selling pressure recently.

Trade volumes remain low, correlating with the ongoing market consolidation.

Support & Resistance

Support around 1.1500, noted by the hammer pattern.

Resistance near 1.1580, previous highs and a significant reversal point.

The current range must be monitored for potential breakouts.

Actionable Insights

Consider buying if the price breaks above 1.1580 with strong volume confirmation and a bullish MACD crossover.

If the price convincingly breaks below 1.1500, supported by increasing volume and the MACD returning to a bearish stance, consider short positions.

Current price action suggests holding until a clear breakout characterizes the next trend direction.

The AI Technical Analysis Center is an informational tool only and does not constitute investment or trading advice.
This site is registered on wpml.org as a development site. Switch to a production site key to remove this banner.