Generic selectors
Exact matches only
Search in title
Search in content
Post Type Selectors

Popular stocks

Crypto

CFD

Currencies

Support

Gold

EUR/USD – Technical Analysis – 4h

December 2, 2025 08:02

Quick Summary

The EUR/USD 4-hour chart indicates a significant bullish trend with signs of strength. Key levels and patterns suggest potential upward momentum, although caution is advised due to potential market indecision.

This analysis aims to provide insights into price movements and actionable strategies for potential trading opportunities.

Candlestick Analysis

The chart shows a recent bullish candlestick pattern, recognizable by the prominent upward movement, likely indicating strong buying pressure.

A doji pattern appears near the current level, suggesting indecision in the market.

There appears to be a bullish trend leading up to the current market level, with some pullbacks along the way. Overall, the trend seems to be showing signs of strength.

MACD Analysis

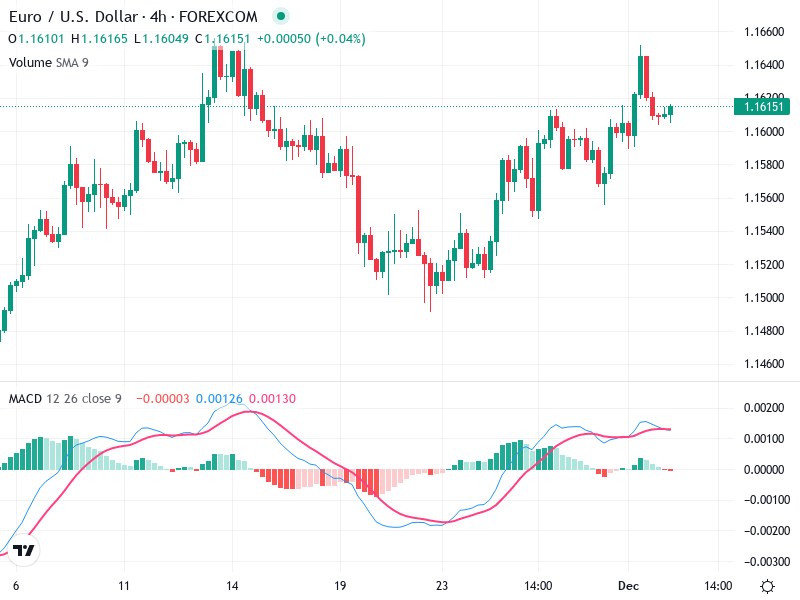
The MACD line has crossed above the Signal line, indicating a bullish crossover, which is a positive signal for upward momentum.

The histogram is above the zero line, supporting the bullish sentiment, but it shows signs of reducing height, suggesting that the upward momentum might be slowing down.

There is no clear divergence between the MACD and price action, indicating that the MACD supports current price movements.

Volume Analysis

Increasing volume during recent uptrends indicates strong buying interest and supports price upward movements.

Any recent spikes might suggest institutional activity or breaking of key levels. The chart shows increased volume on up-moves, which supports bullish sentiment.

Traders should watch for volume patterns that may confirm continuation or reversal of current trends.

Support & Resistance

The area around 1.1560 appears to act as a support level, having previously halted bearish movements.

The region around 1.1640 looks to be a crucial resistance zone, which coincides with recent highs.

Monitoring these levels can help determine potential breakout or pullback points.

Actionable Insights

Consider buying if the price breaks above the 1.1640 resistance with confirmation through continued high volume.

Consider selling if the price fails to break through 1.1640 and starts forming bearish patterns with increasing volume.

If prices stabilize within current levels without decisive action above resistance levels or below support, hold the current position.

The AI Technical Analysis Center is an informational tool only and does not constitute investment or trading advice.
This site is registered on wpml.org as a development site.