Generic selectors
Exact matches only
Search in title
Search in content
Post Type Selectors

Popular stocks

Crypto

CFD

Currencies

Support

Gold

EUR/USD – Technical Analysis – 4h

December 8, 2025 08:02

Quick Summary

The asset chart indicates a potential shift in market momentum. Several technical indicators suggest an evolving trend. Traders should watch key levels for actionable signals.

Candlestick Analysis

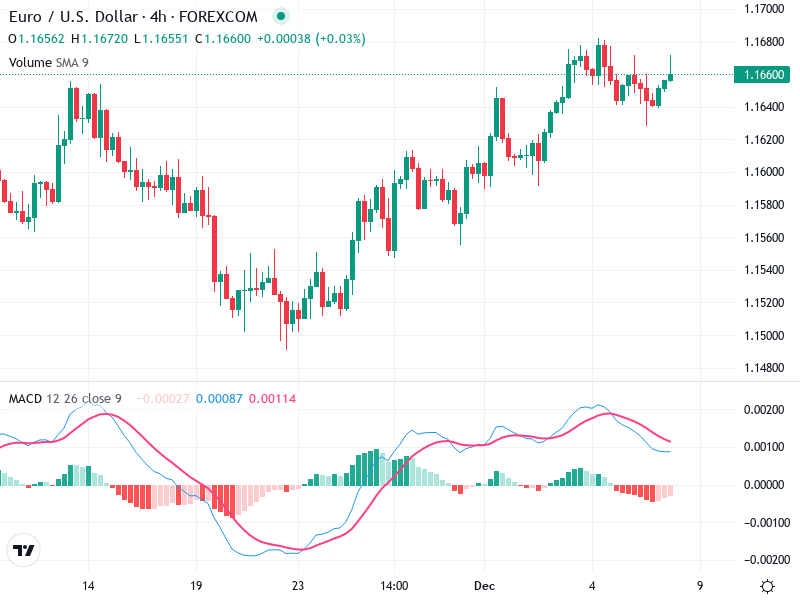
There are several bullish and bearish patterns visible. Notable ones include bullish engulfing patterns indicating potential upward momentum around late November.

The overall trend appears to be sideways with bullish corrections. After a period of decline, there is an upward correction, suggesting a shift towards a more bullish tone.

Recent price action indicates a potential breakout above the 1.1650 level, which is a critical resistance zone to watch.

MACD Analysis

The MACD line is currently close to crossing above the Signal line (potential bullish crossover), which could suggest a strengthening bullish sentiment.

The histogram is showing decreasing negative bars, suggesting a potential shift towards positive momentum.

No significant divergences observed currently; MACD movements are largely confirming the price action.

Volume Analysis

Volume appears to be relatively stable, with no significant spikes indicating large institutional moves recently.

No unusual volume spikes; slight volume increase during upward moves supports price action but lacks strong conviction.

No data available for the third volume parameter at this time.

Support & Resistance

Around 1.1540, the area seems to have acted as solid support during recent declines.

1.1670-1.1700 range is a critical resistance zone that, if breached, could signal further bullish momentum.

No additional data on support/resistance levels at this moment.

Actionable Insights

Consider buying if price breaks above the 1.1670 resistance with strong volume confirmation.

Sell if price fails to maintain above 1.1620, or hold if the trend remains sideways with no significant breakout.

Watch for a clear MACD crossover and volume increase to confirm bullish momentum.

The AI Technical Analysis Center is an informational tool only and does not constitute investment or trading advice.
This site is registered on wpml.org as a development site. Switch to a production site key to remove this banner.