Generic selectors
Exact matches only
Search in title
Search in content
Post Type Selectors

Popular stocks

Crypto

CFD

Currencies

Support

Gold

EUR/USD – Technical Analysis – 4h

December 10, 2025 08:02

Quick Summary

The EUR/USD chart indicates a transition from a bearish trend to a more bullish sentiment. The formation of a bullish engulfing pattern and subsequent consolidation suggests potential for upward movement. Key support and resistance levels at 1.1580 and 1.1660 are pivotal for future price direction.

Candlestick Analysis

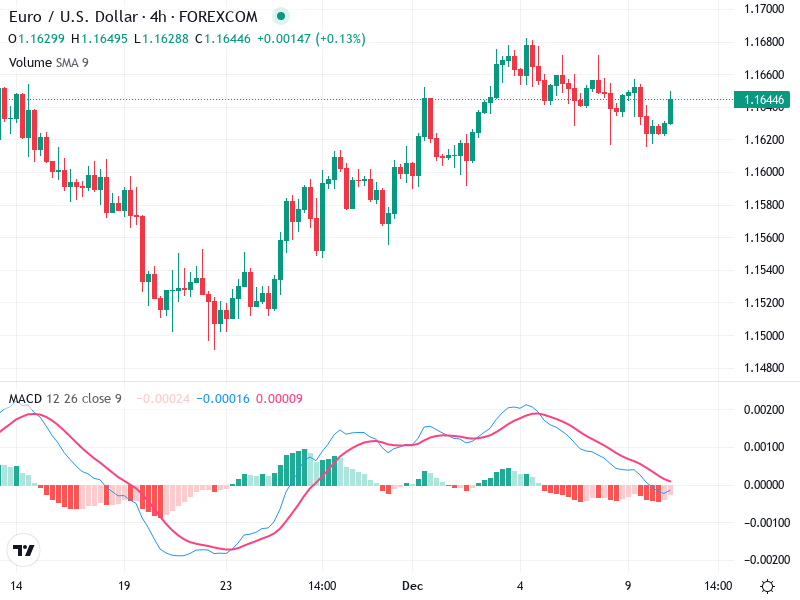
There is a significant bullish engulfing pattern seen after the downward trend near the middle of the chart, indicating a possible reversal point.

A doji appears, suggesting market indecision, which is often followed by a change in trend direction.

The chart shows a transition from a bearish trend in the beginning to a more bullish sentiment as it progresses. After the uptrend, there's a sideways consolidation phase.

MACD Analysis

The MACD line and Signal line are in close proximity, showing a potential bullish crossover, indicating a possible shift to upward momentum.

The histogram shows shrinking red bars, hinting at diminishing bearish momentum and a potential bullish reversal.

No clear divergences are observed currently; however, the shrinking histogram confirms the current price consolidation with potential upside momentum.

Volume Analysis

Volume has been relatively stable with no significant spikes supporting the current consolidating price action.

A volume increase corresponding with a price move could validate a breakout direction.

Current volume levels suggest a wait-and-watch approach for further confirmation.

Support & Resistance

Support is around 1.1580, seen during previous price dips that were followed by rebounds.

Resistance is around 1.1660, aligning with the breakout zone.

These levels are critical for confirming price stability and potential breakout or reversal zones in the future.

Actionable Insights

Consider a buy position if the price breaks above 1.1660 with strong volume support, indicating a bullish breakout.

Conversely, be cautious of a breakdown below 1.1580, which could trigger a short position.

Monitor the MACD for a confirmed bullish crossover for further buy confirmation.

The AI Technical Analysis Center is an informational tool only and does not constitute investment or trading advice.
This site is registered on wpml.org as a development site. Switch to a production site key to remove this banner.