Generic selectors
Exact matches only
Search in title
Search in content
Post Type Selectors

Popular stocks

Crypto

CFD

Currencies

Support

Gold

EUR/USD – Technical Analysis – 4h

December 11, 2025 08:02

Quick Summary

The EUR/USD 4H chart reveals a bullish trend continuation supported by recent technical indicators.

The upward momentum is evident despite the absence of strong reversal patterns.

Key levels are identified that might influence future price movements.

Candlestick Analysis

Recently, there is a bullish candlestick following a pullback, suggesting continuation of upward momentum.

There are no strong reversal patterns like dojis or hammers present.

The chart shows a bullish trend with higher highs and higher lows.

MACD Analysis

A recent bullish crossover is observed, where the MACD line has crossed above the signal line, indicating bullish momentum.

The histogram is increasing, which suggests strengthening momentum in favor of the bulls.

No significant divergences between MACD and price action are noted.

Volume Analysis

Volume appears to be stable, but there was a slight increase supporting the bullish breakout.

The increase in volume aligning with the bullish candlestick suggests participation by bulls in the price movement.

No unusual volume spikes indicating strong institutional activity are evident.

Support & Resistance

Key support is at 1.1600, where a former resistance level could act as new support.

Immediate resistance is seen slightly above 1.1700, which is a psychological level.

Recent price movement suggests a breakout above previous resistance at around 1.1670.

Actionable Insights

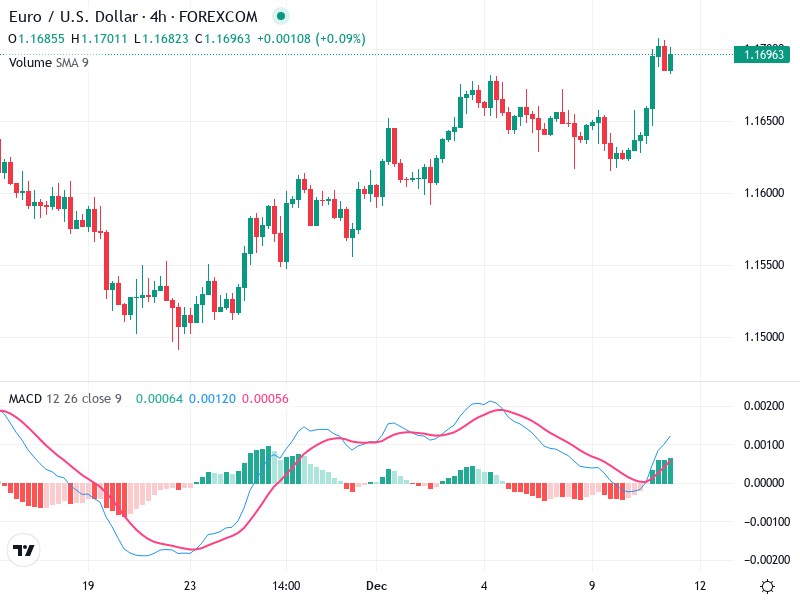
Consider entering a long position with a target above recent highs, confirming with a continued MACD bullish histogram and maintaining above 1.1700.

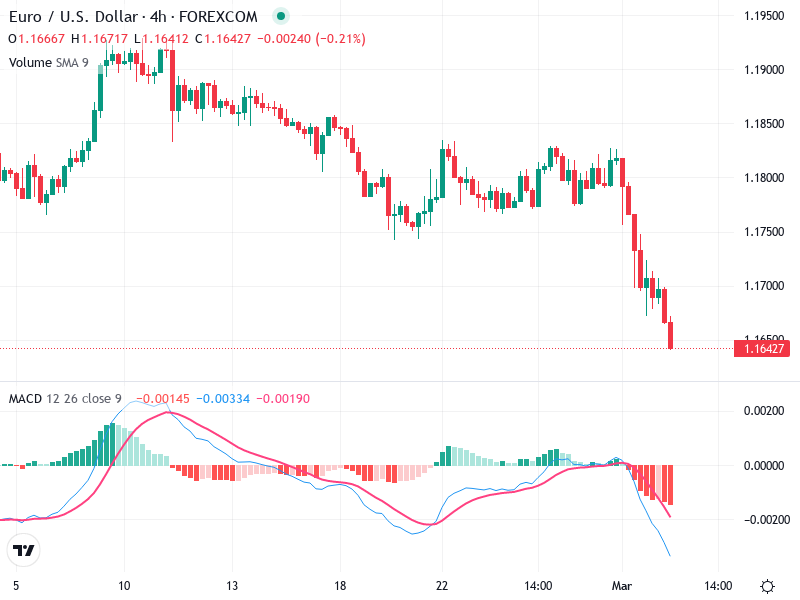
Watch for potential reversal patterns, especially near resistance. A downturn could be triggered by a bearish candlestick pattern or a MACD bearish crossover.

If long positions are held, monitor closely for continuation signals and manage risk with stop-loss just below 1.1600.

The AI Technical Analysis Center is an informational tool only and does not constitute investment or trading advice.
This site is registered on wpml.org as a development site.