Generic selectors
Exact matches only
Search in title
Search in content
Post Type Selectors

Popular stocks

Crypto

CFD

Currencies

Support

Gold

EUR/USD – Technical Analysis – 4h

December 29, 2025 08:02

Quick Summary

The asset chart shows mixed movements with an overall sideways trend. Recent activity highlights key support and resistance levels, offering potential opportunities for traders. Monitoring these levels could provide insights for future price direction changes.

Despite some volatility, the general pattern suggests a cautious approach, waiting for significant movements.

Candlestick Analysis

The overall trend appears to be bullish, though there is currently some sideways movement.

Recent candles show a mix of bullish and bearish activity with no strong pattern dominance.

Key levels around 1.1800 and 1.1750 seem to be acting as recent resistance and support, respectively.

MACD Analysis

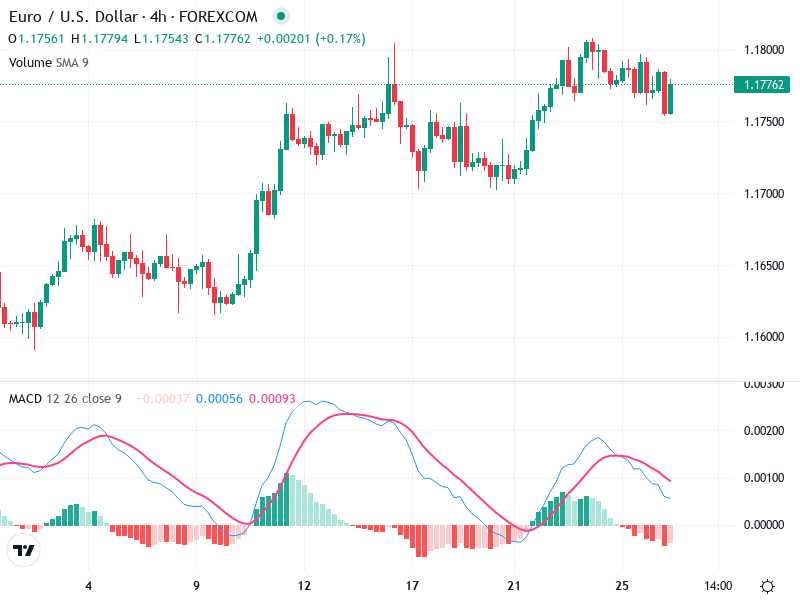
The MACD line is slightly below the Signal line, suggesting a bearish crossover recently occurred.

The histogram shows decreasing momentum as it moves towards zero, supporting the view of potential consolidation or minor bearishness.

No clear divergence is evident between the MACD and price dynamics, both seem aligned with recent sideways movement.

Volume Analysis

Volume levels appear consistent with slight increases during price movements, showing no extraordinary spikes that might indicate strong institutional activity.

The sideways trend corresponds with balanced volume, indicating neither bulls nor bears are dominating.

Monitoring volume for future spikes could suggest potential changes in trading sentiment.

Support & Resistance

Around 1.1750 is a key support level, where buyers have previously stepped in.

Near 1.1800, the price has struggled to break higher, suggesting sellers may accumulate around this level.

These levels could act as pivot points for future price movements.

Actionable Insights

Current signals suggest cautious trading. Consider a hold or neutral position unless a clearer breakout occurs.

Confirmation signals above 1.1800 for potential bullish continuation or below 1.1750 for bearish movement could provide actionable breakout opportunities.

Watch for potential fakeouts around these levels given the sideways consolidation.

The AI Technical Analysis Center is an informational tool only and does not constitute investment or trading advice.
This site is registered on wpml.org as a development site. Switch to a production site key to remove this banner.