Generic selectors
Exact matches only
Search in title
Search in content
Post Type Selectors

Popular stocks

Crypto

CFD

Currencies

Support

Gold

EUR/USD – Technical Analysis – 4h

January 13, 2026 08:02

Quick Summary

The chart for Asset displays a nuanced interplay of forces, providing essential signals for traders. Several indicators point towards the potentiality of a reversal or consolidation phase.

While the overall momentum leans bearish, recent developments suggest possible shifts that merit attention.

Candlestick Analysis

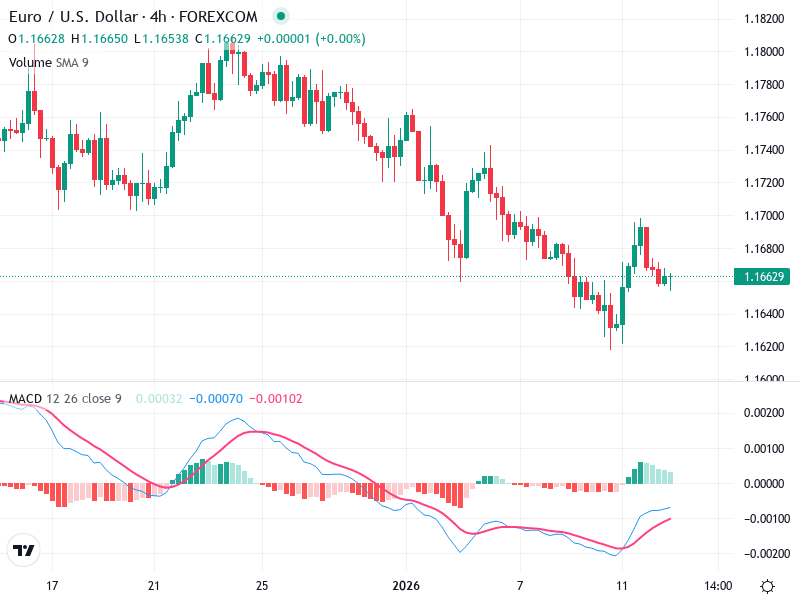
The chart shows multiple bearish candlesticks followed by a few bullish ones, which suggests a potential reversal or consolidation phase.

Recently, there seems to be a potential 'hammer' pattern, indicating possible bullish reversal signals.

The trend appears bearish, as evidenced by the descending pattern of lower highs and lower lows.

MACD Analysis

The MACD line is below the Signal line, indicating bearish momentum is currently in play.

However, the lines are converging, which could suggest a potential crossover if the trend continues.

The histogram bars are shrinking in the negative territory, suggesting the bearish momentum may be weakening.

Volume Analysis

There is generally consistent volume without significant spikes, suggesting steady trading activity.

No significant change indicates institutional interest is lacking at this time.

The steady volume does not strongly support either bullish or bearish price movements, suggesting a lack of conviction in the current trend.

Support & Resistance

Around 1.1630, where recent pullback activity has occurred. This level may act as a minor support base if the price continues to test it.

Near 1.1700, which the price recently failed to break through decisively.

This level acts as a short-term resistance.

Actionable Insights

Consider entering long positions if there is a confirmed bullish crossover in the MACD and if price action breaks above the 1.1700 resistance with strong volume support.

Maintain or increase short positions if the price breaks below the 1.1630 support with increased volume.

Watch for continuation of bearish MACD signals.

The AI Technical Analysis Center is an informational tool only and does not constitute investment or trading advice.
This site is registered on wpml.org as a development site. Switch to a production site key to remove this banner.