Generic selectors
Exact matches only
Search in title
Search in content
Post Type Selectors

Popular stocks

Crypto

CFD

Currencies

Support

Gold

EUR/USD – Technical Analysis – 4h

January 14, 2026 08:02

Quick Summary

The EUR/USD chart is currently showing a bearish trend with significant resistance at 1.1700 and immediate support at 1.1620.

Despite a small bullish candlestick pattern, the pair has not demonstrated strong follow-through.

Traders should remain cautious due to mixed signals from different technical indicators.

Candlestick Analysis

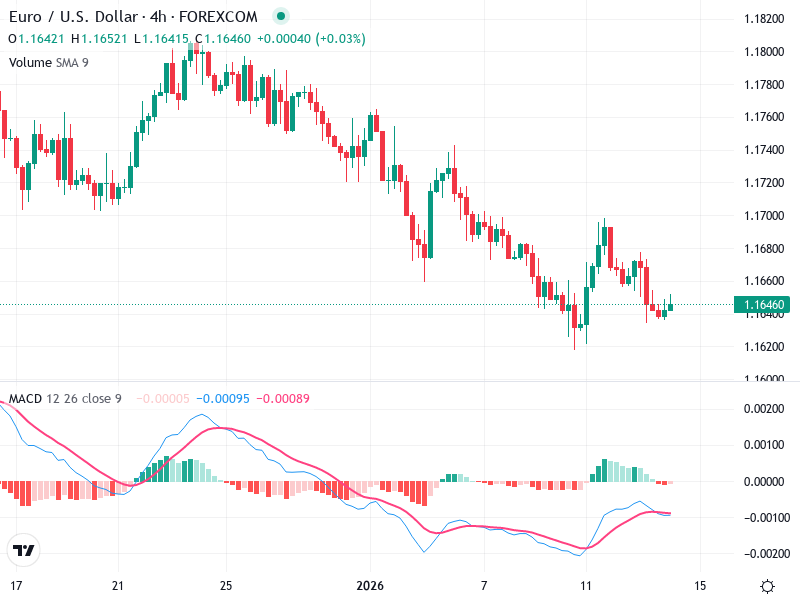
The overall trend is bearish, indicated by a series of lower highs and lower lows.

A small bullish candlestick pattern around December 11 suggests a potential short-term reversal, but it lacks strong follow-through.

Recent pullbacks have struggled to break above 1.1700, indicating resistance.

MACD Analysis

The MACD line is below the Signal line, indicating bearish momentum.

The histogram is negative but showing a slight decrease in bearish momentum as it approaches the zero line.

No significant divergence is observed between the MACD and price action.

Volume Analysis

There is relatively low volume throughout, with slight increases near the recent minor bullish candles.

The lack of strong volume undermines the sustainability of any significant price increases.

No unusual spikes indicating institutional activity are present.

Support & Resistance

Key resistance is noted around 1.1700, which has been tested but not convincingly broken.

Immediate support appears around 1.1620, where previous consolidation occurred.

The levels highlight crucial zones to watch for potential breakouts or reversals.

Actionable Insights

Cautious traders might consider a hold strategy due to mixed signals.

If a bullish reversal is confirmed with higher volume and a MACD crossover, it could signal a buy opportunity.

Watch for confirmation of momentum changes, especially a bullish MACD crossover with increasing volume and a potential break above 1.1700 resistance.

The AI Technical Analysis Center is an informational tool only and does not constitute investment or trading advice.
This site is registered on wpml.org as a development site. Switch to a production site key to remove this banner.