Generic selectors
Exact matches only
Search in title
Search in content
Post Type Selectors

Popular stocks

Crypto

CFD

Currencies

Support

Gold

EUR/USD – Technical Analysis – 4h

January 16, 2026 08:02

Quick Summary

The chart for reveals a prominent downward trend, characterized by persistent bearish movements. Analysis suggests a continuity in this trend with little indication of reversal.

The overall sentiment remains bearish with declining price levels and no significant support from volume or indicators.

Candlestick Analysis

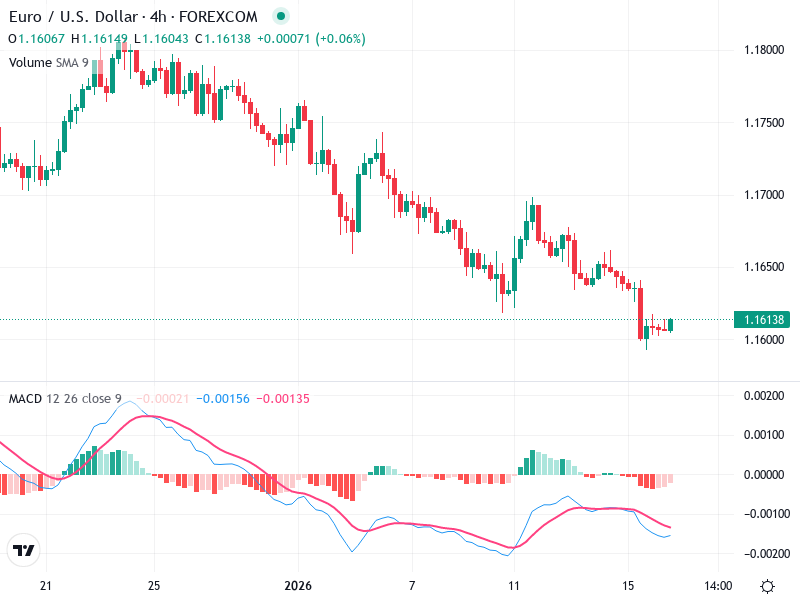
The chart shows a consistent series of bearish candlesticks, indicating a strong downward trend.

There are occasional small-bodied candles, suggesting indecision, but no prominent reversal patterns like a bullish engulfing or hammer.

A small consolidation area around the current level could be observed for potential breakouts or pullbacks.

MACD Analysis

The MACD line is below the Signal line, signaling a continued bearish momentum.

The histogram shows small bars close to the zero line, indicating weak momentum currently.

There is no clear divergence between MACD and price action, supporting the ongoing bearish sentiment.

Volume Analysis

Volume appears relatively stable with occasional spikes.

The volume does not show significant anomalies to contradict the price decrease; instead, it confirms the ongoing trend.

There are no significant volume spikes suggesting major institutional moves.

Support & Resistance

Key support appears to be around the 1.16000 level. If this level breaks, further downside is possible.

Resistance is identified around the 1.17000 mark from previous price action.

These levels are crucial for spotting potential reversals or continuations.

Actionable Insights

Given the bearish trend, a hold or sell strategy is advised unless a reversal pattern is confirmed.

Look for a bullish candlestick pattern for signs of reversal. Monitor the MACD for possible crossover as a confirmation for trend change.

Watch for sudden volume spikes or reversal candle patterns which could indicate a trend shift.

The AI Technical Analysis Center is an informational tool only and does not constitute investment or trading advice.
This site is registered on wpml.org as a development site. Switch to a production site key to remove this banner.