Generic selectors
Exact matches only
Search in title
Search in content
Post Type Selectors

Popular stocks

Crypto

CFD

Currencies

Support

Gold

GBP/USD – Technical Analysis – 4h

February 3, 2026 13:05

Quick Summary

The chart shows in a phase of consolidation following a strong bullish trend. However, recent movements indicate indecision among traders.

The asset has key resistance and support levels that are crucial for predicting future price movements.

Candlestick Analysis

The overall trend is bullish until the recent pullback.

A strong bullish run occurred with multiple higher highs and higher lows.

Recently, there is a consolidation pattern with smaller candles, indicating indecision.

MACD Analysis

The MACD line has crossed below the Signal line, indicating a bearish crossover.

The histogram shows a decrease in bullish momentum, with a shift towards bearish momentum.

There are no clear divergences currently between the price action and the MACD.

Volume Analysis

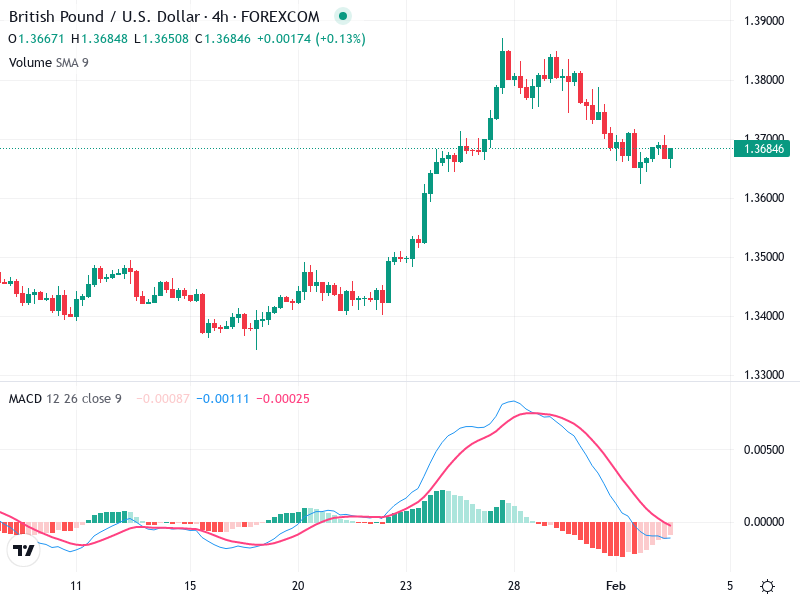
Volume appears stable, with no significant spikes, suggesting the lack of strong momentum change.

The recent price consolidation is accompanied by stable volume, which doesn't support a strong move in either direction currently.

No unusual spikes indicating institutional activity at the moment.

Support & Resistance

The resistance zone is around 1.3800, where the price previously reversed.

The support zone is approximately at 1.3600, as the price has bounced back from this area.

Actionable Insights

Consider waiting for a clearer signal before entering a position.

A break above 1.3800 with volume could indicate a buy, while a break below 1.3600 could suggest a sell.

Watch for a MACD crossover back to bullish or any candlestick patterns indicating a reversal.

The AI Technical Analysis Center is an informational tool only and does not constitute investment or trading advice.
This site is registered on wpml.org as a development site. Switch to a production site key to remove this banner.