Generic selectors
Exact matches only
Search in title
Search in content
Post Type Selectors

Popular stocks

Crypto

CFD

Currencies

Support

Gold

GBP/USD – Technical Analysis – 4h

February 19, 2026 13:04

Quick Summary

The USD/CAD chart reveals a bearish trend with consistent price declines.

The asset price has been under pressure, with the downtrend confirmed by multiple technical indicators.

Key levels are being tested, highlighting significant market sentiment shifts.

Candlestick Analysis

The chart shows a downtrend with predominantly red candlesticks indicating bearish momentum.

A recent large bearish candlestick suggests a continuation of the trend.

The trend is clearly bearish with lower highs and lower lows.

MACD Analysis

The MACD line is below the Signal line, indicating a bearish crossover.

This suggests increasing bearish momentum.

The histogram is negative and widening, reinforcing the strength of the bearish momentum.

Volume Analysis

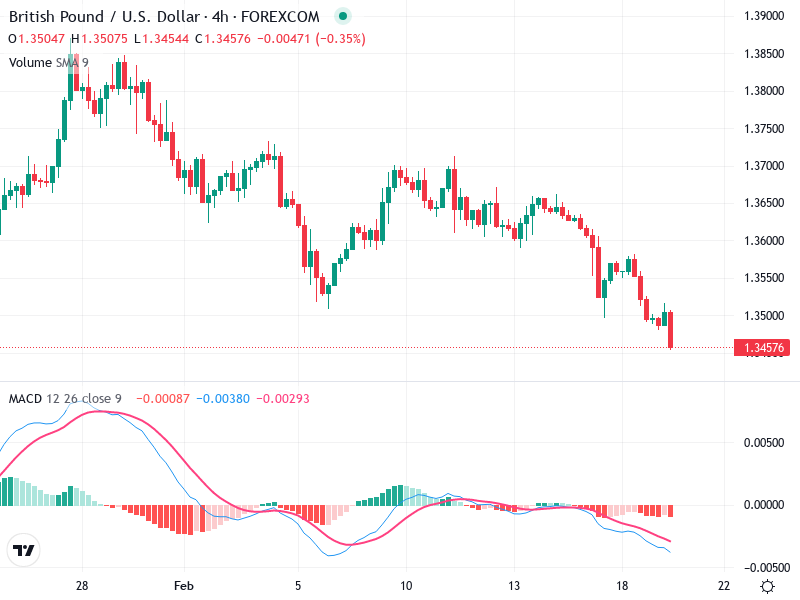
Volume appears relatively stable with no major spikes, though recent activity saw a slight increase in volume supporting the bearish candlestick.

The slight increase in volume supports the recent price decline, confirming selling pressure.

No significant unusual spikes suggestive of institutional activity.

Support & Resistance

The next significant support zone is around 1.3400, which could serve as a potential reversal point if selling pressure continues.

Resistance is evident near 1.3550, where previous attempts to rally were stalled.

Actionable Insights

Consider short positions on a confirmed close below 1.3450.

Current bearish momentum might suggest holding off on buying until a reversal signal is observed.

Only consider buying if there is a clear bullish reversal pattern or breakout above recent resistance levels.

The AI Technical Analysis Center is an informational tool only and does not constitute investment or trading advice.
This site is registered on wpml.org as a development site. Switch to a production site key to remove this banner.