Generic selectors
Exact matches only
Search in title
Search in content
Post Type Selectors

Popular stocks

Crypto

CFD

Currencies

Support

Gold

GBP/USD – Technical Analysis – 4h

February 23, 2026 13:04

Quick Summary

The chart presents key insights into the recent market dynamics.

Predominantly bearish trends are visible, with intermittent signals of potential reversals.

Traders should pay close attention to identified support and resistance levels for actionable strategies.

Candlestick Analysis

The chart shows a predominantly bearish trend, indicated by lower highs and lower lows.

While there is no significant pattern like a bullish engulfing or hammer, there was a small bullish reversal around February 18th, suggesting a potential pullback.

Recent candlesticks reflect indecision (small body), indicating uncertainty or a potential pause in trend.

MACD Analysis

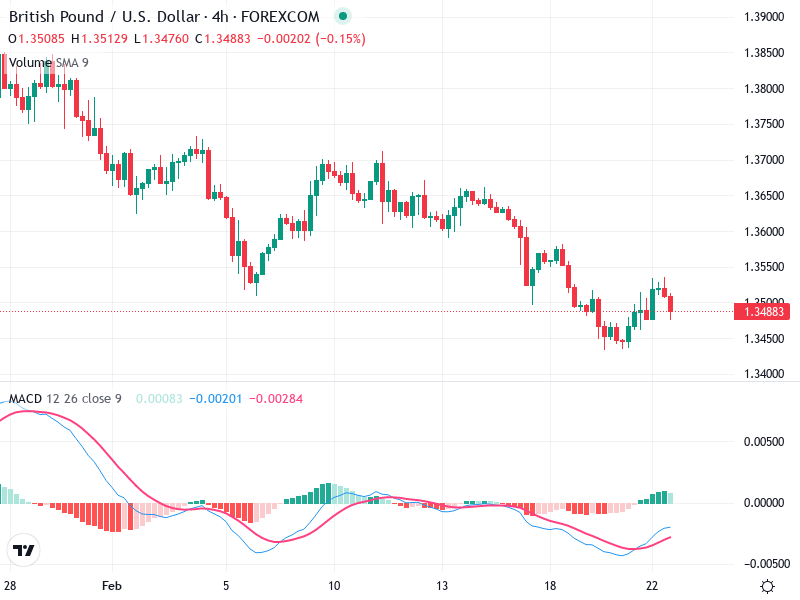
The MACD line is below the signal line, which is a bearish indicator. However, it seems to be converging, which could suggest weakening bearish momentum.

The histogram has been increasing, indicating decreasing bearish pressure. If it crosses above zero, it may suggest a short-term bullish momentum.

No clear divergence between the MACD and price action at this point, which confirms the current bearish sentiment.

Volume Analysis

Volume remains relatively stable; no significant spikes to suggest strong buying or selling pressure.

The steady volume implies that the recent price movements are not strongly supported by broader market participation.

Absence of unusual spikes suggests lack of institutional activity, reinforcing the general trend.

Support & Resistance

Key support level identified around 1.3400. If this level breaks, expect further downward pressure.

Resistance is seen near 1.3550-1.3600. A break above could lead to a bullish move.

These levels are critical for traders seeking reversal or breakout opportunities.

Actionable Insights

Consider buying if there’s a confirmed breakout above 1.3550 with supporting volume and MACD crossover.

Selling may be advisable if the price moves decisively below 1.3470, with increasing volume and MACD divergence.

Holding might be prudent until a clear directional move is observed, especially for risk-averse traders.

The AI Technical Analysis Center is an informational tool only and does not constitute investment or trading advice.
This site is registered on wpml.org as a development site. Switch to a production site key to remove this banner.