Generic selectors
Exact matches only
Search in title
Search in content
Post Type Selectors

Popular stocks

Crypto

CFD

Currencies

Support

Gold

GBP/USD – Technical Analysis – 4h

February 24, 2026 13:04

Quick Summary

The chart for reveals significant insights. Despite recent fluctuations, pivotal areas have emerged that traders should monitor closely. Evaluating various technical indicators, this analysis aims to provide a comprehensive outlook on potential movements.

Candlestick Analysis

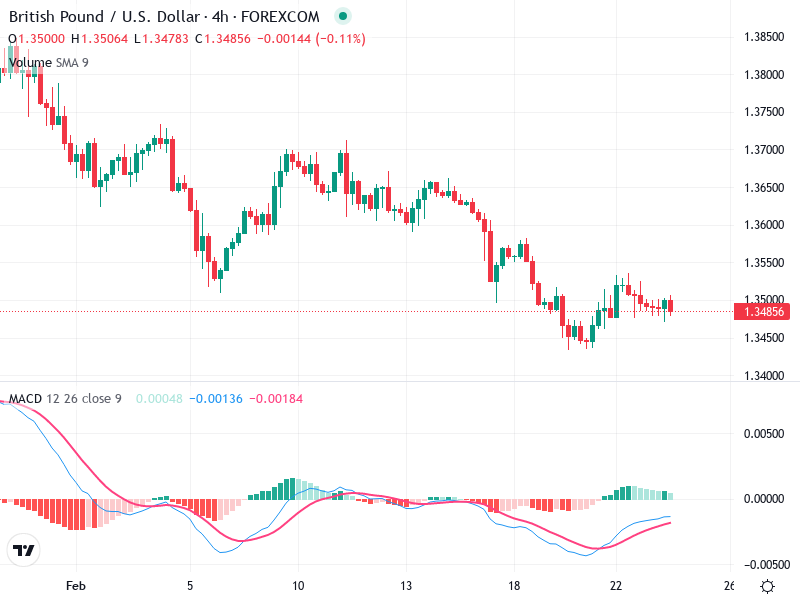
The overall trend in the chart is bearish, as indicated by the series of lower highs and lower lows.

Recently, there was a bullish reversal pattern suggesting a potential change in direction, which is visible in a few bullish candlesticks after a downtrend.

The price seems to have experienced a pullback after a steady decline, indicating a consolidation phase.

MACD Analysis

The MACD line is slightly above the Signal line, indicating a recent bullish crossover. This could suggest a potential shift in momentum.

The MACD histogram is currently in the positive territory, although the bars are short, indicating weak bullish momentum.

There is no clear divergence between MACD and price action at this point.

Volume Analysis

There was a noticeable increase in volume during the recent downtrend, supporting the bearish price movement.

Currently, volume seems to have decreased, which is typical during consolidation phases, indicating a potential lack of interest and uncertainty.

The previous spike in volume could suggest institutional selling pressure during the decline.

Support & Resistance

A key support level can be seen around 1.3400, where price action has previously bounced.

Immediate resistance is around 1.3550, where the price has faced selling pressure recently.

Actionable Insights

Consider entering a long position if the price breaks above the 1.3550 resistance with increased volume and MACD showing stronger bullish momentum.

Enter a short position if the price breaks below the support level at 1.3400, with confirmation from downside volume and bearish MACD crossover.

If the price remains in consolidation between 1.3400 and 1.3550, hold off on trading until a clear trend or breakout is established.

The AI Technical Analysis Center is an informational tool only and does not constitute investment or trading advice.
This site is registered on wpml.org as a development site. Switch to a production site key to remove this banner.