Generic selectors
Exact matches only
Search in title
Search in content
Post Type Selectors

Popular stocks

Crypto

CFD

Currencies

Support

Gold

GBP/USD – Technical Analysis – 4h

February 26, 2026 13:04

Quick Summary

The GBP/USD 4-hour chart suggests a potential bullish reversal following recent price movement.

Key indicators align with the bullish trend, emphasizing the significance of monitoring resistance levels.

Candlestick Analysis

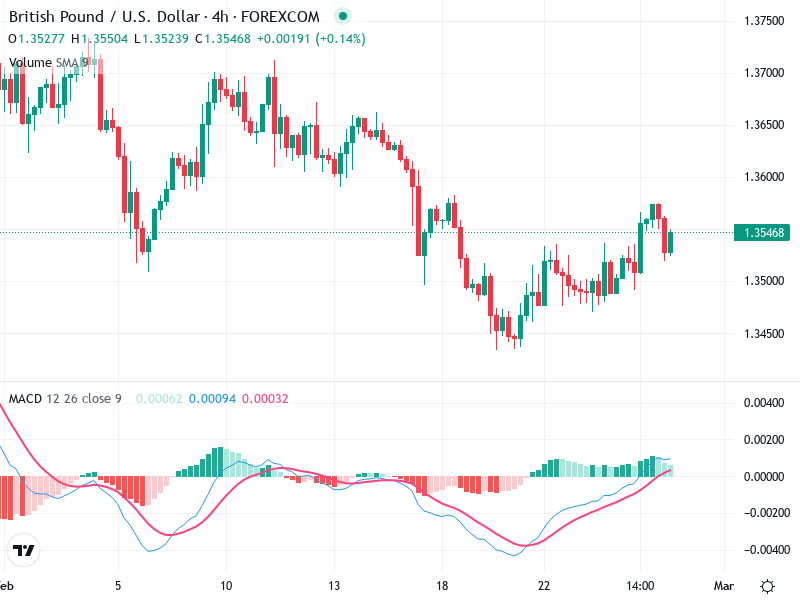
There is a potential bullish reversal pattern forming, as indicated by the recent green candlesticks following a period of bearish movement.

The recent candlestick can be seen as a potential bullish engulfing pattern, indicating buying interest.

Currently, the chart shows a possible shift from a bearish trend towards a bullish reversal, indicated by higher lows and attempted higher highs.

MACD Analysis

The MACD line is crossing above the Signal line, indicating a bullish crossover which may suggest upward momentum.

The histogram is showing positive bars, confirming the bullish crossover and suggesting increasing bullish momentum.

No noticeable divergences between MACD and price action currently, with both supporting each other.

Volume Analysis

There is a noticeable increase in volume with the recent bullish candles, supporting the upward move.

No substantial spikes suggesting unusual institutional activity, but the volume does support the current upward price action.

The increase in volume adds credibility to the ongoing bullish movement.

Support & Resistance

Immediate support at around 1.3500, an area previously tested and held.

Major resistance level at 1.3650, where price was previously rejected.

Watch for sustained movement past these levels for confirmation of a trend direction.

Actionable Insights

Consider buying on confirmed break above the resistance zone at 1.3545 with volume support and keep an eye on the resistance at 1.3650 for further confirmation.

If price fails to sustain above 1.3545, watch for a return to support at 1.3500 for potential selling opportunities.

For those already invested, holding could be considered while monitoring for confirmation signals to see if the bullish momentum is sustained.

The AI Technical Analysis Center is an informational tool only and does not constitute investment or trading advice.
This site is registered on wpml.org as a development site. Switch to a production site key to remove this banner.